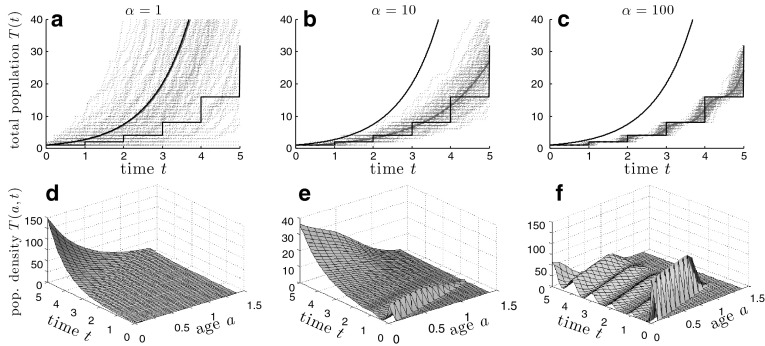
Fig. 4.
Plots of simulations and analytic results of a fission-only process with -distributed branching times. a, b, and c show mean populations as a function of time for dispersion values , , and , respectively. Red dotted trajectories are realizations of simulations, while the solid red line is the mean. The blue dashed curve is the mean population T(t) computed from Eq. 71 and is nearly indistinguishable from the red solid curve. The upper and lower black lines correspond to the continuous-time Markovian fission process and the discrete-time Galton-Watson process, respectively. d, e, and f depict the corresponding mean age-distributions T(x, t) computed from Eq. 58 but plotted as functions of time t and age a

