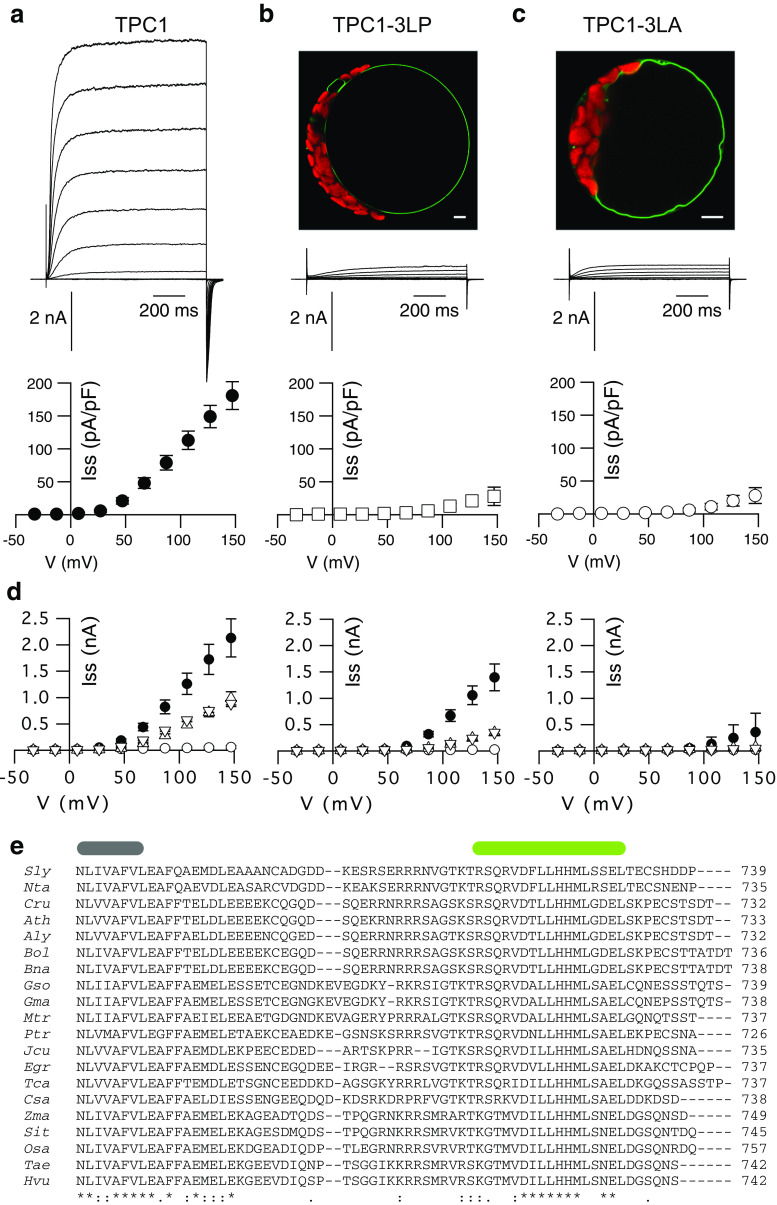
Fig. 2.
Point mutations within a conserved C-terminal region reduce TPC1 activity. a–c Representative whole-vacuolar current responses (top) and current–voltage relations (bottom) of corresponding steady-state currents of TPC1-GFP variants as indicated at the top. Applied voltages ranged from −73 to +147 mV in 20 mV intervals, starting from a holding potential of −53 mV; current–voltage curves are shown starting from −43 mV. Additionally shown in b and c are confocal fluorescence overlay images of the GFP (green) and chlorophyll (red) signals of corresponding mesophyll protoplasts (scales represent 5 μm). a TPC1-GFP as in Fig. 1 (closed circles, n = 4), b TPC1-3LP-GFP (open squares, n = 7), c TPC1-3LA-GFP (open circles, n = 8). d Current–voltage relations of excised cytosolic side-out vacuolar membrane patches of TPC1-GFP (closed circles), TPC1-S706A-GFP (upward triangle), and TPC1-S706D-GFP (downward triangle) expressing cells as well as tpc1-2 mutants (open circles), with cytosolic [Ca2+] of 1 mM (left), 0.2 mM (middle), or 0.05 mM (right), respectively (n = 3–7). e C-terminal alignment of TPC1 from different plant species. Gray bar indicates the end of transmembrane segment S12, as predicted for AtTPC1 [84]. Green bar denotes the predicted C-terminal helix for AtTPC1. Aly-Arabidopsis lyrata; Ath-Arabidopsis thaliana; Bna-Brassica napus; Bol-Brassica oleracea; Cru-Capsella rubella; Csa-Cucumis sativus; Egr-Eucalyptus grandis; Gma-Glycine max; Gso-Glycine soja; Hvu-Hordeum vulgare; Jcu-Jatropha curcas; Mtr-Medicago truncatula; Nta-Nicotiana tabacum; Osa-Oryza sativa; Ptr-Populus trichocarpa; Sit-Setaria italica; Sly-Solanum lycopersicum; Tae-Triticum aestivum; Tca-Theobroma cacao; Zma-Zea mays

