Fig. 3.
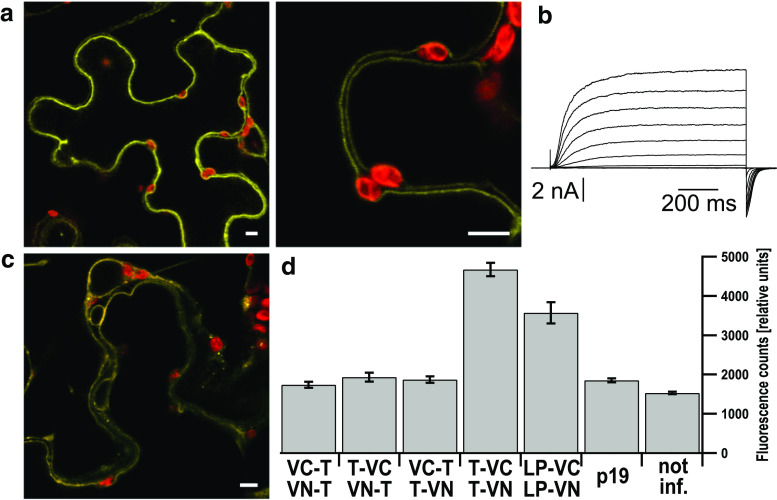
The C-termini of two TPC1 monomers interact with each other. a Confocal fluorescence overlay images of the Venus (yellow) and chlorophyll (red) signals of a tobacco cell co-expressing TPC1 fused to Venus-Ct (TPC1-VC) and TPC1 fused to Venus-Nt (TPC1-VN), shown at two different magnifications (scales represent 5 μm). The BiFC signals emerge from the tonoplast. b Whole-vacuolar current response of a tpc1-2 cell co-expressing the same constructs as in (a). c Confocal fluorescence overlay image of the YFP (yellow) and chlorophyll (red) signals of a tobacco cell co-expressing TPC1-3LP-VC and TPC1-3LP-VN (scales represent 5 μm). The BiFC signals emerge from endomembranes and tonoplast. d Fluorescence signal intensities of BiFC experiments in relative units, determined from leaf disks with a fluorescence reader. VC-TPC1 and VN-TPC1 (n = 23), TPC1-VC and VN-TPC1 (n = 23), VC-TPC1 and TPC1-VN (n = 23), TPC1-VC and TPC1-VN (n = 38), TPC1-3LP-VC and TPC1-3LP-VN (n = 11). As negative controls leaf disks only expressing the helper strain p19 (n = 28) and not infiltrated leaves (n = 39) were used

