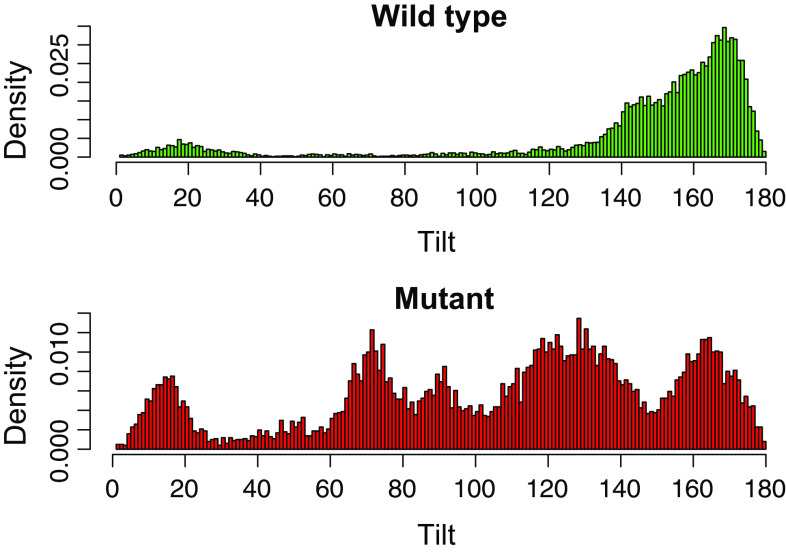
Fig. 6.
CTH dimer tilt distribution reflects an increased flexibility of mutant dimers. Tilt angles between coarse-grained dimers were determined over the last 50 ns from each simulation and plotted in a histogram (x-axis: tilt, y-axis: density). The density distribution of tilt angles between mutant dimers (bottom) is compared to wild type dimers (top) very diffuse, pointing to an increased flexibility of mutant dimers

