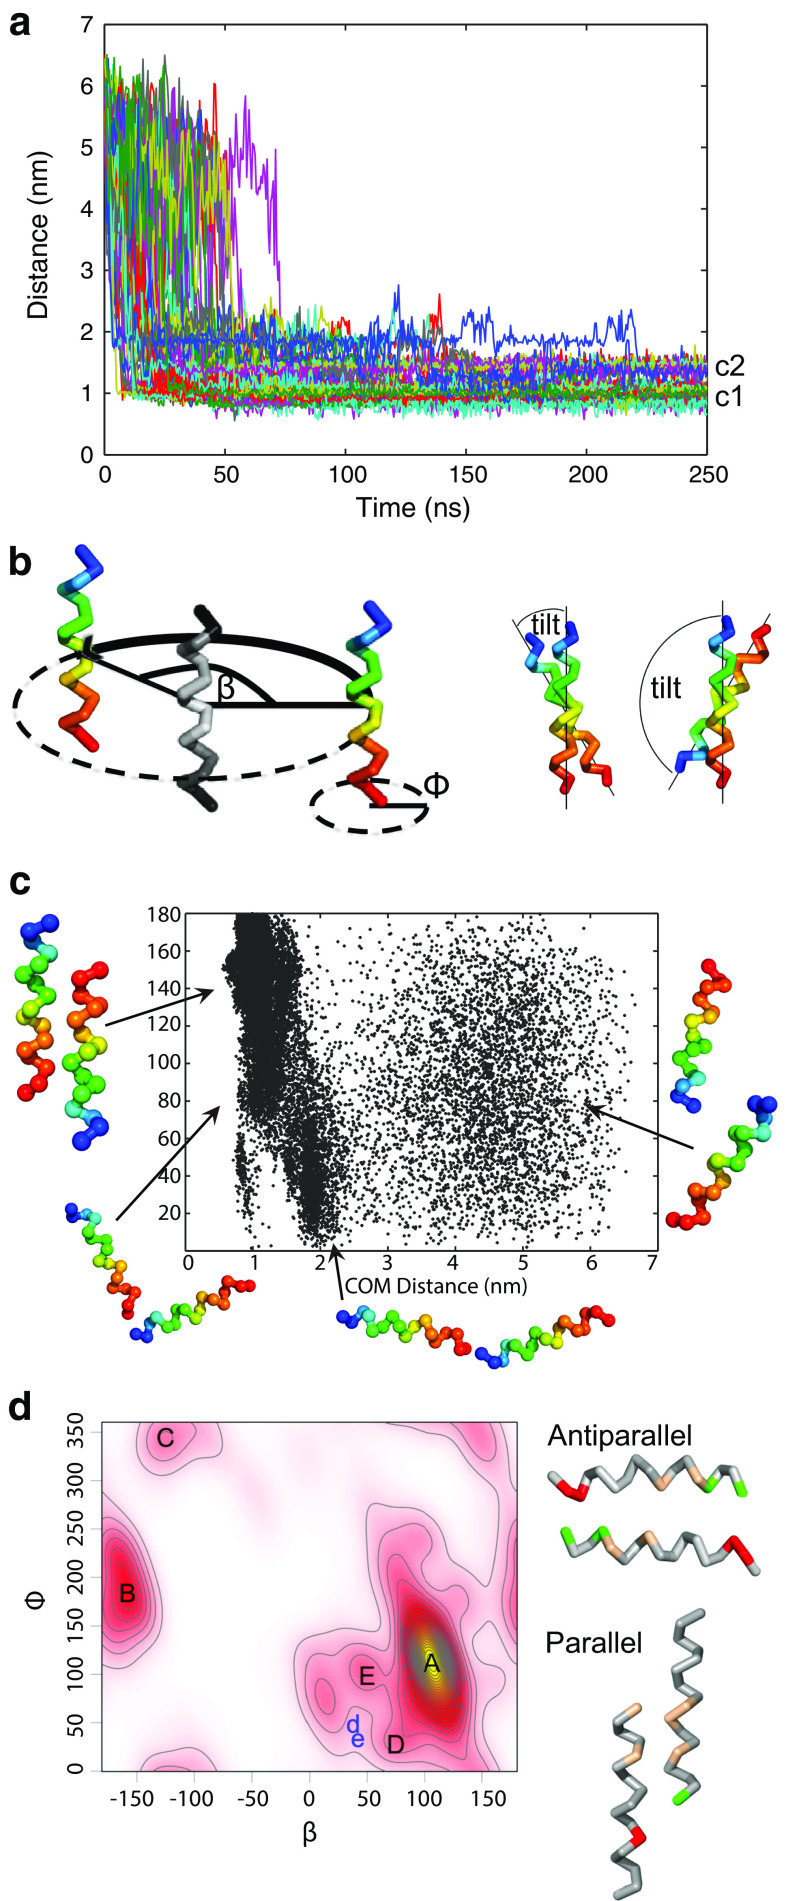
Fig. 7.
In silico dimerization study of the carboxy-terminus of TPC1. a Center of mass (COM) distance between the two helices (residues 707–723), with initial values between 5.5 and 6.5 nm, as a function of simulation time. Different colored lines represent 100 independent coarse-grained (CG) simulations. c2 and c1 indicate two populations of dimers distinguished by their COM distance. b Schematic representation of angles used to analyze the orientation of bound helices. β describes the position of the binding partner to the reference structure (colored in gray), ϕ is the rotation around the helical axis, and the tilt angle depicts the tilt between the peptides. Lower tilt values (≤50°) point to parallel binding and larger (≥130°) to antiparallel binding. Helices were colored in rainbow scheme from N-terminus (blue) to C-terminus (red). c Center of mass distances of two monomers forming homo-dimers in antiparallel arrangement, shown for all simulations resulting in antiparallel configurations. d Left: Kernel density for β and ϕ angle combinations in the last 50 ns of the CG simulations, describing the relative orientation of peptides. The yellow area indicates a high density, white color a low density. Antiparallel dimers were found in clusters A and B, parallel dimers in C and D, others in E. Two selected conformations from clusters D and E were finally observed at positions in phase space d and e, respectively, after backmapping to atomistic resolution followed by atomic-scale molecular dynamics simulations. Right Orientation for the antiparallel and parallel homo-dimers. Glutamic and aspartic acids are colored red, arginine green, and hydrophobic residues light brown. For clarity, only interacting residues are colored

