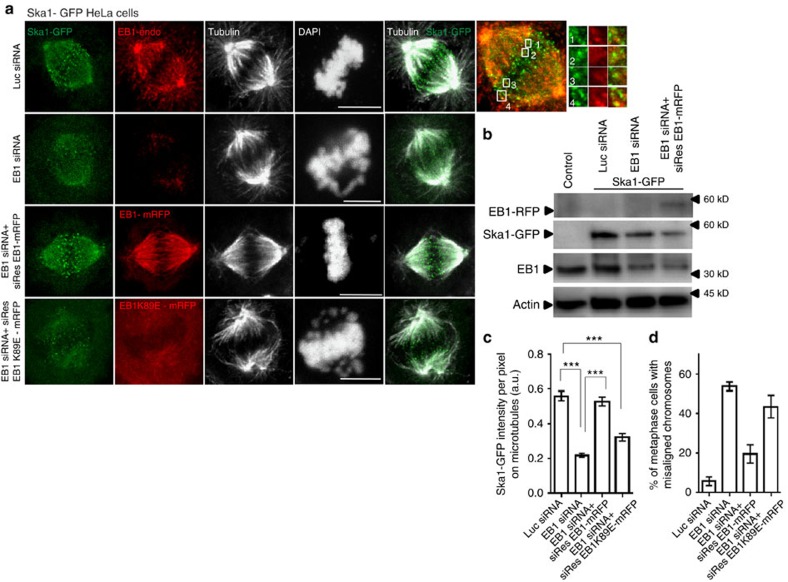
Figure 1. EB1 co-localizes with Ska1 on the spindle microtubules and its depletion induces loss of Ska1 from the microtubules.
(a) Immunofluorescence confocal images of Ska1–GFP expressing HeLa cells transfected with luciferase siRNA, EB1 siRNA, EB1 siRNA+siRNA-resistant EB1–mRFP construct (siRes EB1–mRFP) and EB1 siRNA+siRNA-resistant EB1K89E-mRFP mutant (siRes EB1K89E-mRFP). Scale bar, 10 μm. Enlarged image on the right shows localization of Ska1–GFP (green) and endogenous EB1 (EB1-endo) (red) in a representative control cell. (b) Western blot showing the expression levels of EB1 (endogenous), Ska1–GFP and siResEB1-mRFP in Ska1–GFP HeLa cells under different conditions as specified. (c) Quantification of intensity of Ska1–GFP on the spindle microtubules at different conditions as specified, representation of regions selected for quantification is shown in Supplementary Fig. 1H, method of analysis is provided in ‘Methods' section (n=∼10–30) ***P<10−10. (d) Plot shows the percentage of metaphase cells with misaligned chromosomes in Ska1–GFP HeLa cells under different conditions as specified, (n=∼100). Data are mean±s.e.m.

