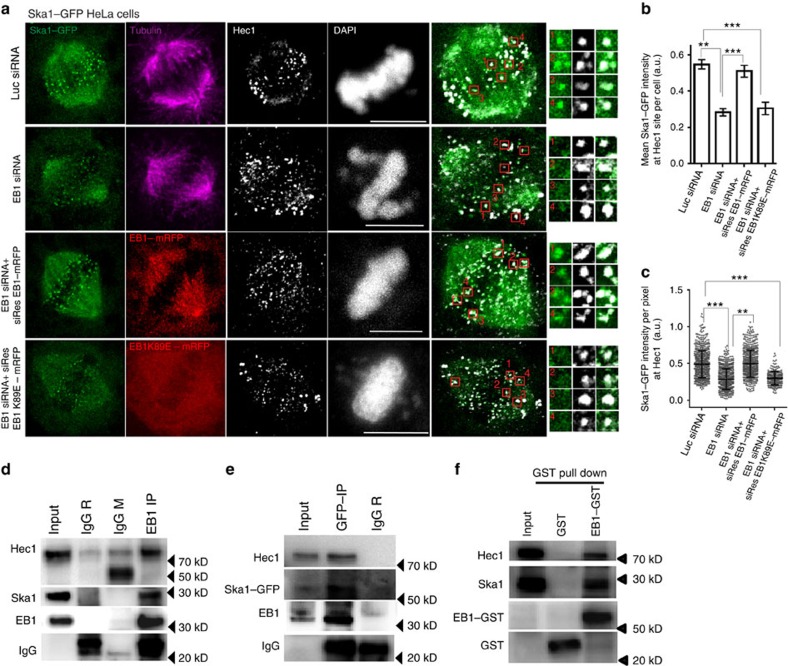
Figure 2. EB1 depletion interferes with Ska1 localization at the spindle-kinetochore attachment site.
(a) Representative immunofluorescence confocal images of Ska1–GFP HeLa cells transfected with luciferase siRNA, EB1 siRNA, EB1 siRNA+ siRes EB1–mRFP or EB1 siRNA+ siRresEB1-K89E mRFP. Cells were immunostained with α-tubulin (pink) and Hec1 (white) antibodies. DNA was stained with DAPI (shown in white). Scale bar, 10 μm. Enlarged images and the selected regions shown in boxes correspond to Ska1–GFP localization at Hec1 sites at above specified conditions. (b) Plot showing quantification of mean Ska1–GFP intensities at Hec1 site considering sum of intensities at all Hec1 sites in a cell at different treatment conditions as specified (no of cells∼10–30). (c) Plot showing intensity values of Ska1–GFP at each Hec1 site in individual cells at the specified treatment conditions (data shown for ∼10–30 cells). ***P<10−10, **P<10−5. Data are mean±s.e.m. (d) Lysates of double thymidine-treated synchronized mitotic shake-off HeLa cells were subjected to immunoprecipitation with EB1 antibody followed by Western blot analysis for detecting EB1, Ska1 and Hec1. Rabbit and mouse IgG were used as control. (e) Lysate of Ska1–GFP HeLa cells was subjected to immunoprecipitation using rabbit GFP antibody and probed for Ska1–GFP, EB1 and Hec1 in Western blot. (f) Lysate of synchronized mitotic HeLa cells was incubated with purified GST–EB1 and subjected to GST pull down using glutathione sepharose beads. Ska1 and Hec1 pulled-down with EB1-GST were detected by Western blot. Purified GST was used as control (shown in middle lane).

