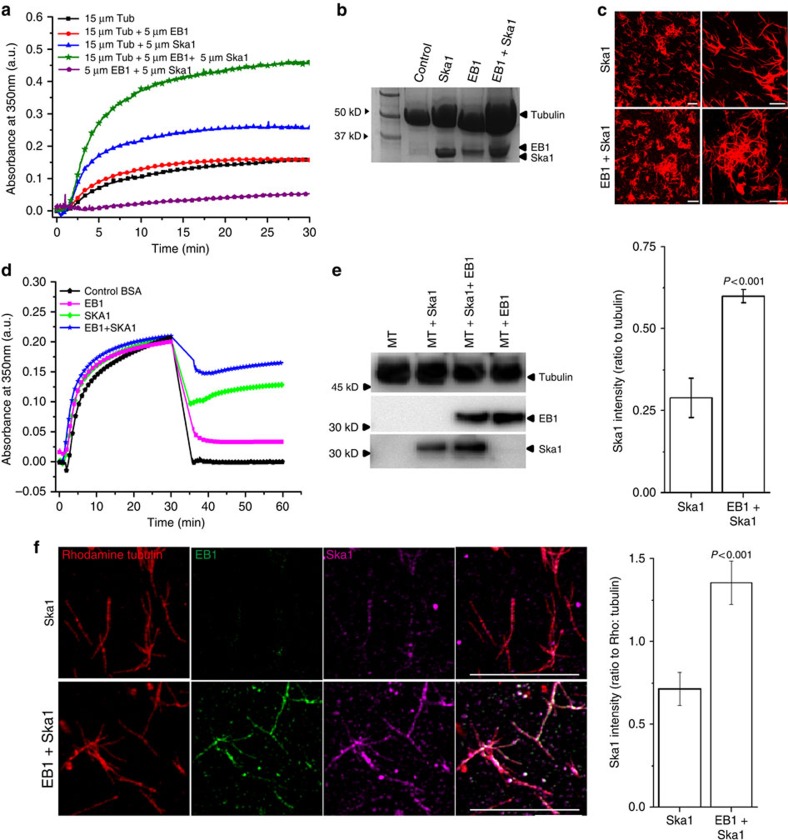
Figure 4. EB1 stabilizes microtubule polymerization together with Ska1 and facilitates Ska1 recruitment onto microtubules.
(a) Polymerization of tubulin (15 μM) in the presence of either EB1–Ska1 mixture (5 μM each) or EB1 (5 μM) and Ska1 (5 μM) alone was monitored by measuring the turbidity at 360 nm. (b) Microtubules polymerized in the presence of EB1–Ska1 mixture or EB1 or Ska1 alone, were sedimented using sucrose cushion and analysed for the proteins present by SDS–PAGE followed by Coomassie staining. (c) Images show rhodamine-labelled microtubules polymerized in the presence either EB1–Ska1 mixture (5 μM each) or Ska1 (5 μM) alone. Scale bar, 10 μm. (d) Pre-polymerized microtubules with 25% glycerol were incubated with EB1-Ska1 mixture or EB1 and Ska1 alone for 5 min and diluted by 2 fold to measure the stability of microtubules against depolymerization. BSA was used as a control. (e) Polymerized microtubules incubated either with EB1 (1 μM), Ska1 (1 μM) or the mixture of EB1 (1 μM) and Ska1 (1 μM) were pelleted by centrifugation through 15% sucrose cushion and the proteins were analysed by western blot. Plot shows the densitometric analysis of the relative amounts of Ska1 recruited to the microtubules in the absence and presence of EB1. (f) Rhodamine-tubulin labelled microtubules incubated either with Ska1 (1 μM) or the mixture of EB1 (1 μM) and Ska1 (1 μM) at 35 °C for 5 min were sedimented onto the coverslips through glycerol cushion. Microtubules were immunostained with EB1 (green) and Ska1 (pink) antibodies. Scale bar, 10 μm. Plot depicts the quantification of intensity of Ska1 on the microtubules in the presence and absence of EB1, no of microtubule analysed=∼50. Data are mean±s.e.m.

