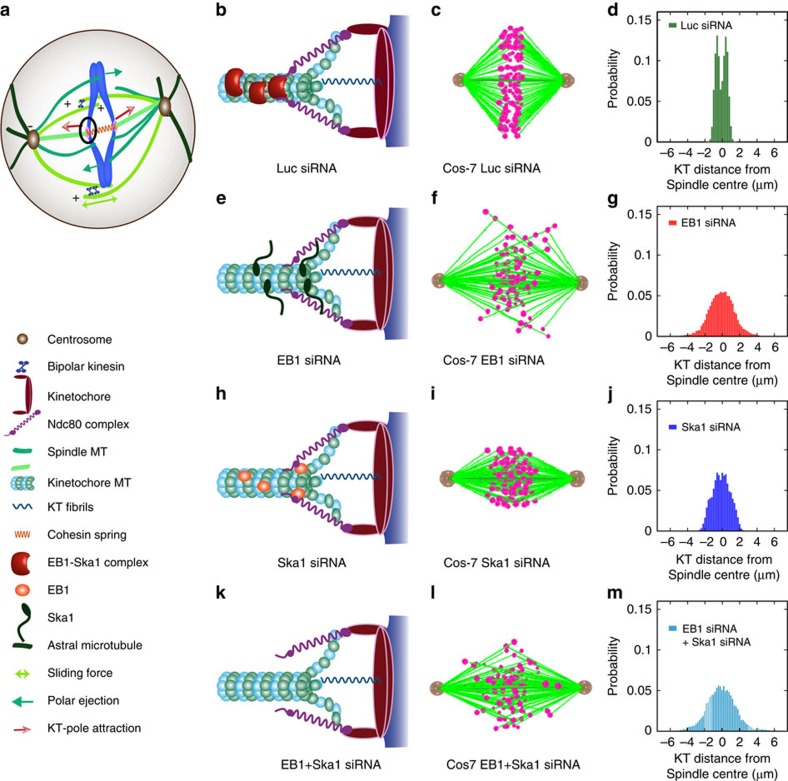
Figure 6. Computational modelling of chromosome distribution.
(a) Cartoon showing a simplified mechanistic model of mitotic spindles with various components and forces. (b) Model of the kMT-KT attachment configuration in control Luc siRNA-treated Cos-7 cells; the model shows that EB1–Ska complex microtubule-binding structures couple kMT with Ndc80 in control cells. (c,d) are simulation snapshot of chromosomal configuration and distribution around the metaphase plate in these cells, respectively. The snapshots of in silico phenotypes show perfectly aligned chromosomes at the metaphase plate. (e–g) are the model of the kMT–KT attachment, simulation snapshot of chromosomal configuration and distribution in EB1-depleted cells, respectively. In the EB1-depleted cells, due to absence of EB1–Ska structures, the depolymerizing kMTs often fail to recover leading to defective kMT–KT attachment. The in silico snapshot shows dispersed chromosomes around the metaphase plate. Note that some residual Ska proteins are still present on the kMT that can weakly interact with Ndc80. (h–j) are the model of the kMT–KT attachment, simulation snapshot of chromosomal configuration and distribution in Ska1-depleted cells, respectively. The snapshot shows dispersed chromosomes with wider distribution around the metaphase plate. Some dispersed oligomeric structures of EB1 present on the microtubule are able to weakly interact with Ndc80. (k–m) correspond to the model, chromosomal configuration and distribution when EB1 and Ska1 are co-depleted. The snapshot and the distribution plot show chromosomes scattered all over the spindles. Simulation was carried out with ∼100 samples in each case.

