
Figure 2. Normalized histogram of the radius of gyration of AChR trajectories.

Measured PDF  of the normalized
  for the AChR trajectories taken under different sample conditions: cultured for 1 day after dissection (red circles), cultured for 4 days (magenta triangles), and cultured for 8 days (green diamonds). Each
  is obtained by averaging the data from 10 cells cultured under the same condition. The black circles are obtained by averaging the data from 70 cells. Their statistics is considerably improved with small error bars indicating the standard deviations. The solid black line shows the exponential function,
 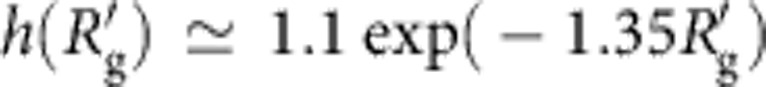 . The dashed blue line shows the measured
  for silica spheres undergoing Brownian diffusion. The vertical red line indicates the cutoff value
 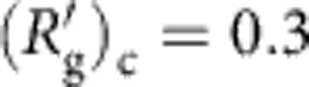 used to define the immobile trajectories.