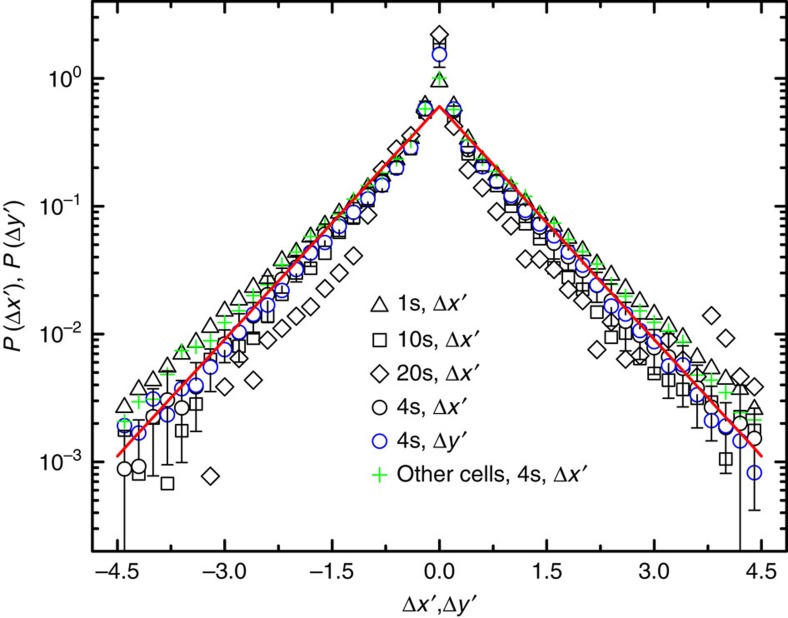
Figure 5. Non-Gaussian behaviour of the normalized histogram of AChR's displacements.
Measured PDFs P(Δx′) and P(Δy′) of the normalized displacements Δx′ and Δy′ for the trajectories of mobile AChRs. Data are obtained from 10 cells under each sample condition: (i) Δx′(τ) with τ=1 s (black triangles), 4 s (black circles), 10 s (black squares) and 20 s (black diamonds); (ii) Δy′(τ) with τ=4 s (blue circles) and (iii) Δx′(τ) with τ=4 s for a group of 10 cells from a different frog (green crosses). The red solid line is an exponential fit to the data points, P(Δx′)≃a exp (−β|(Δx′)|), with a=0.6 and β=1.4.

