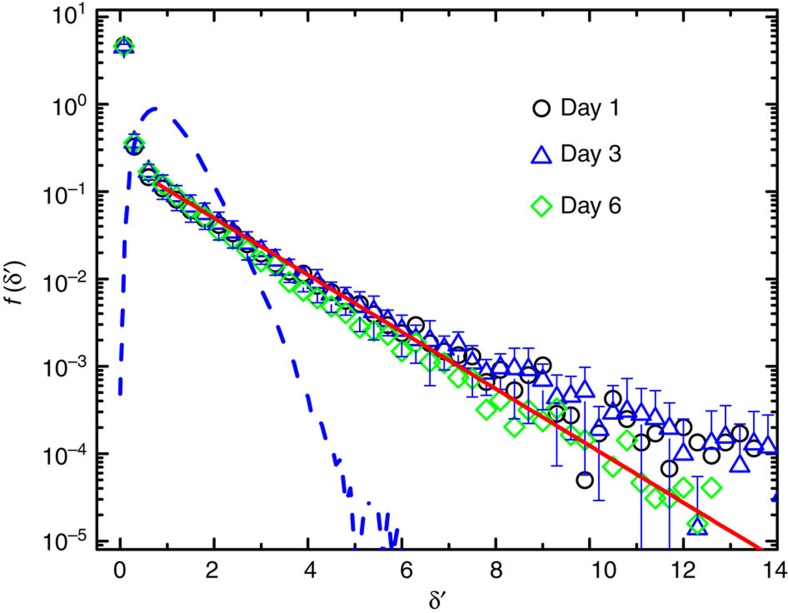
Figure 6. Normalized histogram of the ‘instantaneous' diffusion coefficient of mobile AChRs.
Measured PDF f(δ′) of the normalized diffusion coefficient δ′=δ/DL for the mobile AChR trajectories. Data are obtained from three groups of 10 cells each cultured for (i) 1 day (black circles), (ii) 3 days (blue triangles) and (ii) 6 days (green diamonds). The error bars show the standard deviation of the blue triangles averaged over 10 cells. The red solid line is an exponential fit to all data points, f(δ′)≃0.22 exp (−0.75δ′). The blue dashed line shows the measured f(δ′) for the silica spheres undergoing normal Brownian diffusion.

