
Fig. 10.
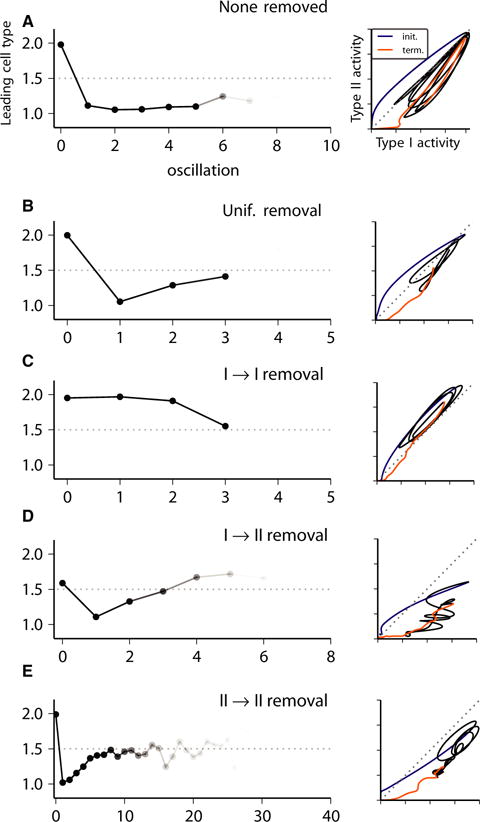
Phase diagrams of Type I vs. Type II firing rate curves during a single representative burst (right panels) and intraburst causality diagrams (left panels; see Materials and methods) for network bursting activity in excitatory heterogeneous networks with no synapses removed (A) or with 25% of synapses removed, randomly chosen uniformly among the four synapse types (B), and all Type I–I (C), all Type I–II (D), or all Type II–II (E). In the phase diagrams (left), the different time intervals of the burst trajectory are indicated by curve colour: blue, burst initiation; black, intraburst activity; gold, burst termination. The intraburst causality diagram (right) indicates the average of the cell type (1.0, Type I; 2.0, Type II) whose firing rate curve, shown in the lower panels of Figs 3A, 4A, 5A and 6A, led activation of burst initiation (0th oscillation) and subsequent intraburst oscillations in activity. Decreased opacity of the curve reflects the fraction of bursts in the simulation showing the number of oscillations.