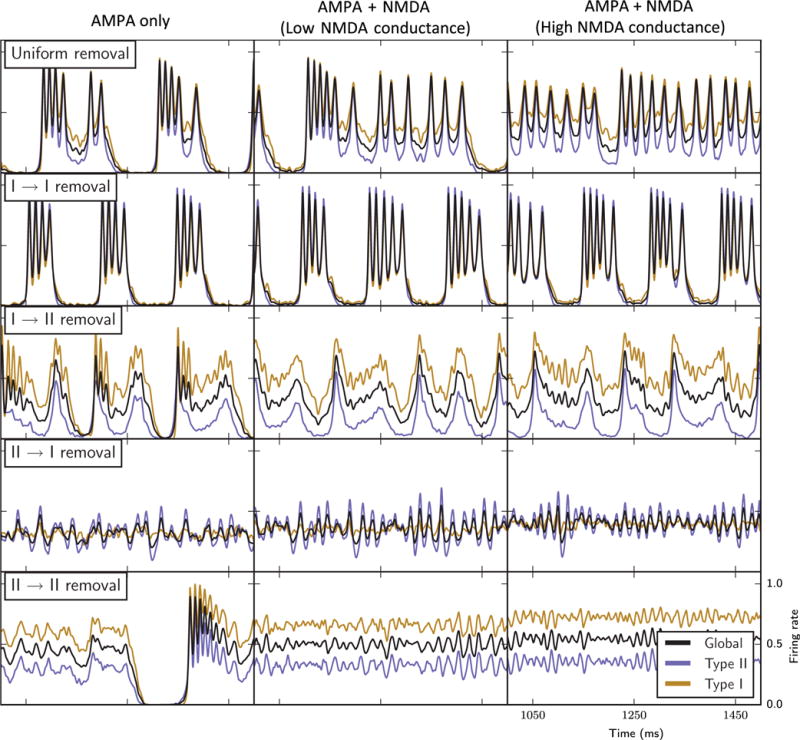
Fig. 12.

Network bursting behaviours with the inclusion of slower NMDA-like synaptic currents in addition to fast AMPA-like synaptic currents (see Materials and methods): firing rate curves of the entire network (black curves), Type I cells only (gold curves) and Type II cells only (blue curves) in the different synapse removal cases (labelled rows) with only AMPA synapses (left column, similar to the results shown in Figs 3–7), with NMDA synaptic conductance twice that of AMPA synaptic conductance (middle column), and with NMDA synaptic conductance four times that of AMPA synaptic conductance (right conductance).
