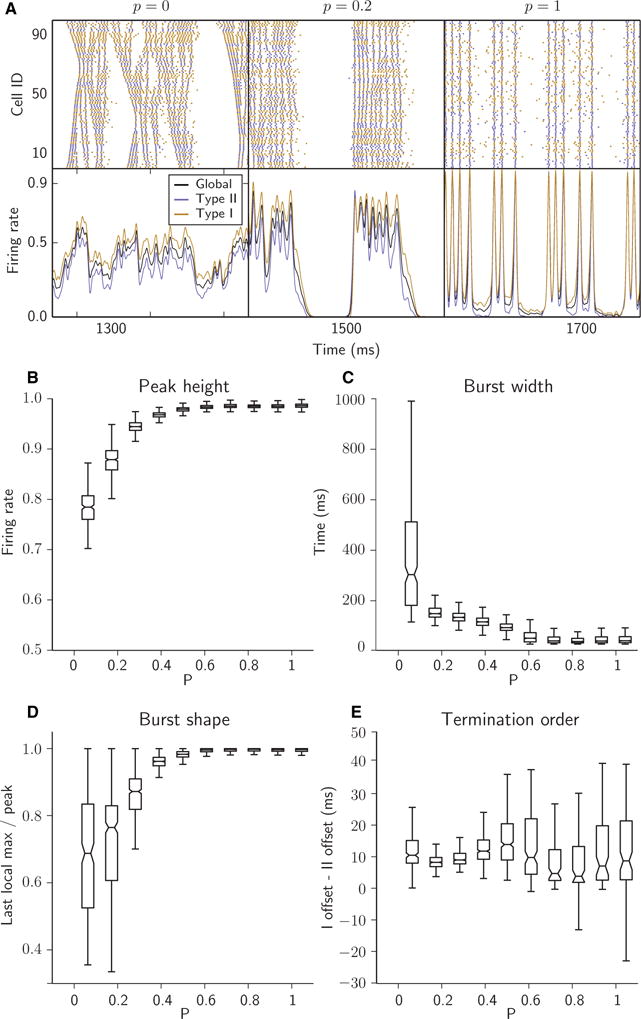
Fig. 2.

Randomness of synaptic connectivity promoted population bursting and synchrony. (A) Raster plots (top panels) and time-dependent firing rates (bottom panels; see Materials and methods) for networks with different degrees of randomness in synaptic connectivity controlled by parameter p. All networks are composed of 250 Type I and 250 Type II cells, each with 4% connectivity (synaptic out-degree k = 20). (B–E) Tukey boxplots showing the relationship between randomness in network connectivity (parameter p) and four bursting metrics (p = 0 not included, owing to absence of bursting). The bottom, midline and top of each box represent the lower quartile (25th percentile, or Q1), median (50th percentile, or Q2), and upper quartile (75th percentile, or Q3), respectively; whiskers extend down from Q1 and up from Q3 to cover 1.5 times the interquartile range (Q3–Q1) of the samples. (B) Peak height of network firing rate during the burst. (C) Burst width. (D) Ratio of the last local maximum of network firing rate before termination to the highest peak in firing rate within the burst. (E) Difference in offset times of Type I and Type II firing rates at burst termination.
