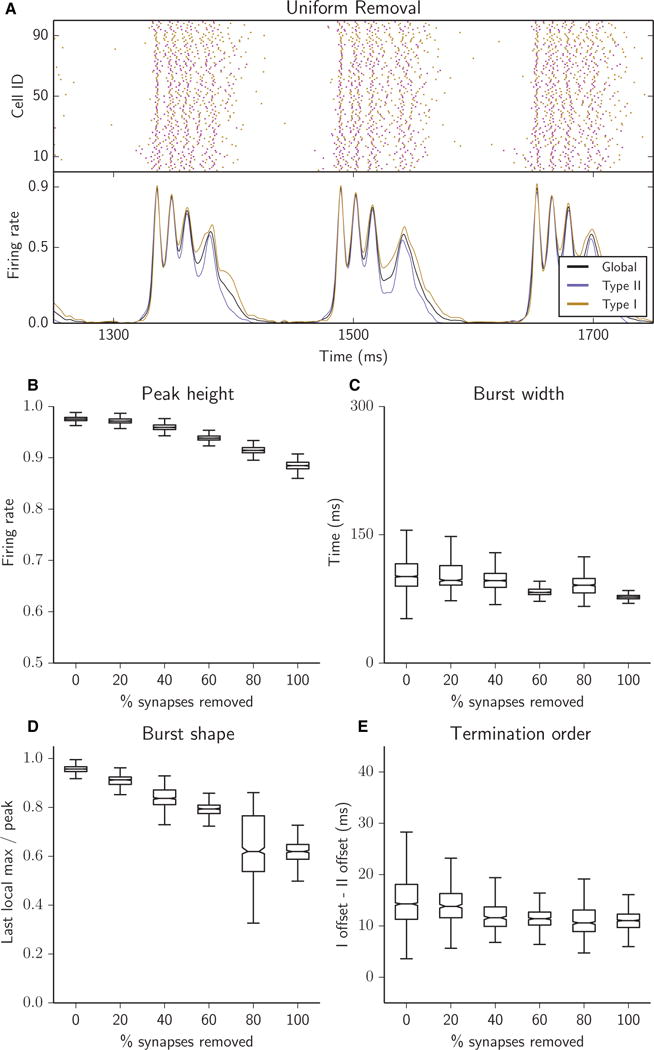
Fig. 3.

Reducing the overall connectivity of the network resulted in bursts with reduced peak height (B), shorter duration (C), a falling ceiling as intraburst oscillations decreased in magnitude with successive synaptic removal (D), and closely matched firing rates of Type I and Type II cells during burst termination (E). (A–E) Raster plots (A, top panel), network firing rates (A, bottom panel) and bursting metrics (B–E, boxplots as in Fig. 2) for an excitatory heterogeneous network with 25% of synapses removed (A) or with 5% of synapses successively removed (B–E), for synapses randomly chosen uniformly among the four synapse types (see Materials and methods).
