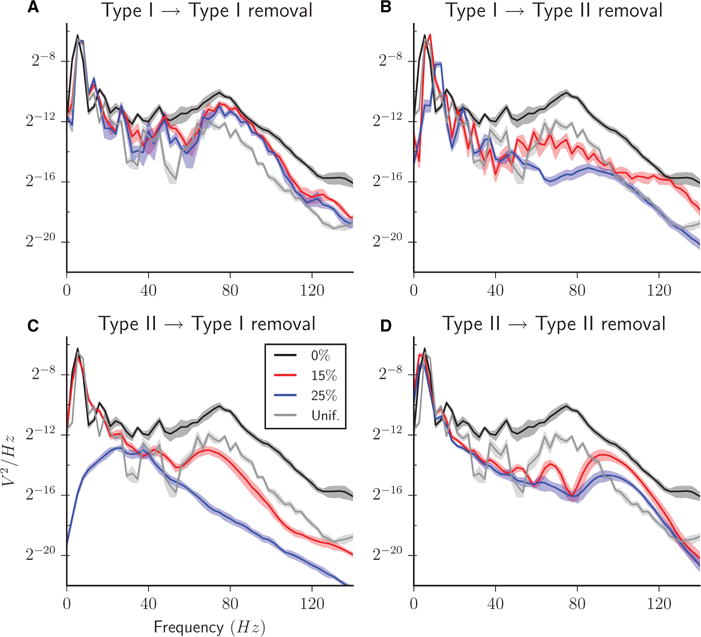
Fig. 8.

PSD functions of the global network firing rate curves for heterogeneous excitatory networks with 0% (black curve), 15% (red curve) and 25% (blue curve) of synapses removed, all Type I–I (A), Type I–II (B), Type II–I (C), or Type II–II (D). PSD for networks with 25% of synapses removed randomly chosen uniformly among the four synapse types is shown for comparison in each panel (grey curve). In all curves, the centre curve is the average across five simulation runs, and the shadow region indicates the standard deviation interval.
