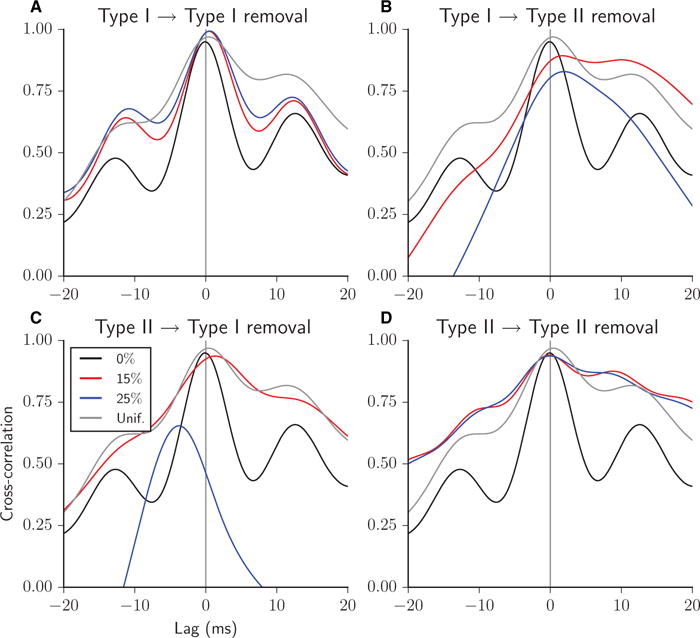
Fig. 9.

Cross-correlation between the Type I and Type II firing rate curves for heterogeneous excitatory networks with 0% (thin black curve), 15% (thick red curve) and 25% (thick blue curve) of synapses removed, all Type I–I (A), Type I–II (B), Type II–I (C), or Type II–II (D). Cross-correlation for networks with 25% of synapses removed randomly chosen uniformly among the four synapse types is shown for comparison in each panel (thin grey curve). A positive time lag corresponds to Type II leading.
