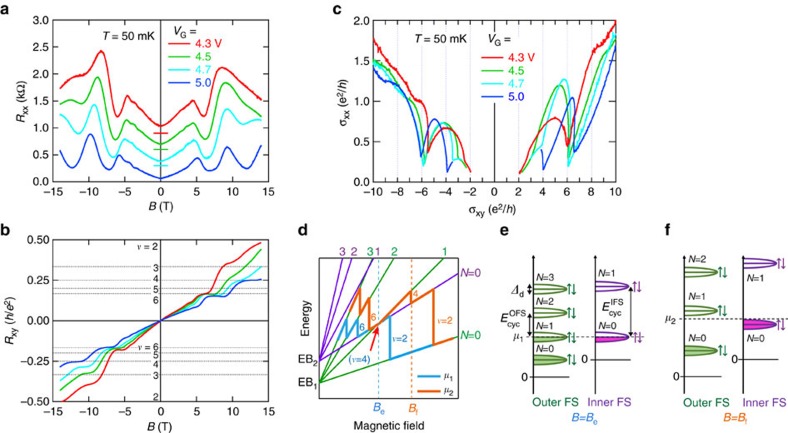
Figure 3. Carrier density dependence of quantum transport in δ-doped SrTiO3.
(a,b) Longitudinal resistance Rxx (a) and Hall resistance Rxy (b) versus magnetic field B measured at 50 mK with various VG's. For Rxx, the traces are shifted vertically for clarity as denoted by horizontal bars. Horizontal dotted lines in b are the Landau level filling factors (ν=2−6). (c) Parametric plots of (σxy(B), σxx(B)) for various gate voltages at 50 mK. (d) A schematic of Landau levels as a function of magnetic field. Green and purple lines correspond to the Landau levels (N) of outer (EB1) and inner (EB2) subbands, respectively. All lines contain up and down spin states, assuming spin degeneracy due to the small g-factor. The thick blue and orange lines illustrates the chemical potentials (μ1 and μ2) for low and high VG's. If the chemical potential (blue line μ1) is located at the crossing point of N=1 of the outer subband and N=0 of the inner subband (indicated by the arrow), then ν=4 is expected to vanish. Shifting the chemical potential upward away from this crossing point (exemplified by the orange line (μ2)), ν=4 can appear. (e) Landau level arrangement when ν=4 disappears. Δd is the Landau level broadening.  and
and  are the cyclotron energies of the outer and inner FSs, respectively. Note that each Landau level N is spin degenerate. (f) Landau level arrangement when ν=4 can be observed.

