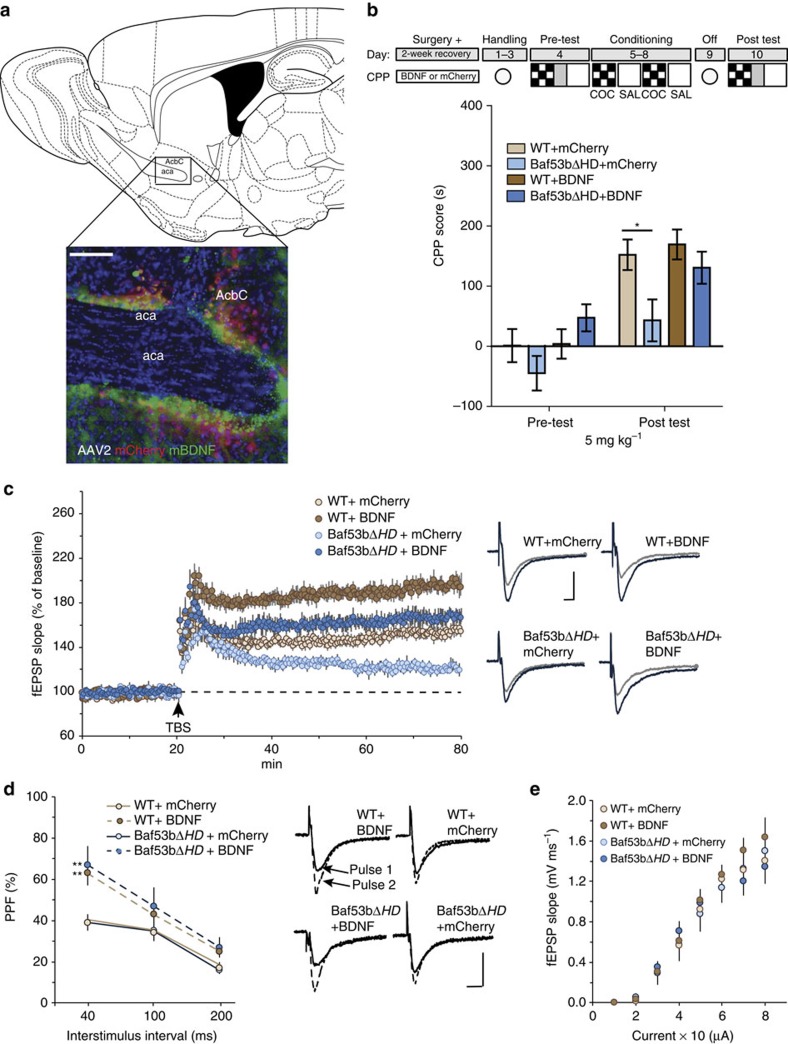
Figure 6. Viral overexpression of BDNF reverses CPP and LTP deficits in Baf53bΔHD mice.
(a) Immunohistological image showing viral expression in the NAc using mCherry (red), BDNF (green) and DAPI (blue). Scale bar, 100 μm. Schematic representation of cocaine-CPP procedure. (b) Cocaine-CPP expression indicated by mean CPP score (CS+versus CS−)±s.e.m. At 5 mg kg−1 cocaine dose, WT+mCherry (n=15) and WT+BDNF (n=16) robust CPP. Baf53bΔHD+BDNF (n=12) established a CPP comparable to WT groups. Baf53bΔHD+mCherry (n=14) exhibited significantly attenuated CPP score compared with WT groups. A two-way repeated-measures analysis of variance (ANOVA) revealed a significant main effect of group (F3,53=3.08, P=0.035) and conditioning (F3,53=95.10, P<0.0001) There was a significant interaction (F3, 53=2.90, P=0.043). Bonferroni post-hoc analysis showed no initial preference for either context on the pretest (t=2.861, P<0.05). (c) Left, the initial expression of LTP was significantly greater in WT+BDNF slices (n=7) relative to WT+mCherry (t15=2.32, P=0.018) slices (n=10), as was the level of potentiation 60 min after TBS in the former group (t15=6.95, P<0.0001). In contrast, slices (n=9) from Baf53bΔHD+BDNF mice produced a similar level of short-term potentiation as found in slices (n=8) from Baf53bΔHD+mCherry mice (t15=1.14, P=0.13); however, virally expressing BDNF in Baf53bΔHD mice rescued the impairment in LTP found in slices from mice expressing the control mCherry-linked virus (t15=6.10, P<0.0001). There was no significant difference in the level of potentiation at 60 min post TBS between WT+mCherry and Baf53bΔHD+BDNF slices (t17=P=0.09). Right, representative traces collected during initial baseline recordings (grey line) and 60 min post TBS (black line) for each group. Scale bar, 5 ms per, 0.5 mV. (d) Left, virally expressing BDNF caused a significant increase in paired-pulse facilitation (PPF) at the shortest interval tested (40 ms) in slices from both WT and Baf53bΔHD mice (F3,30=13.8, P=0.025). Right, representative examples of PPF recorded at 40 ms interstimulus interval for each group tested. Traces of the first (solid black line) and second (dotted black line) fEPSPs are superimposed. Scale bar, 5 ms per, 0.5 mV. (e) Input/Output curves measuring the slope of the fEPSP response across a range of stimulation currents (10–80 μA) was comparable among all groups (F3,30=0.25, P=0.87).

