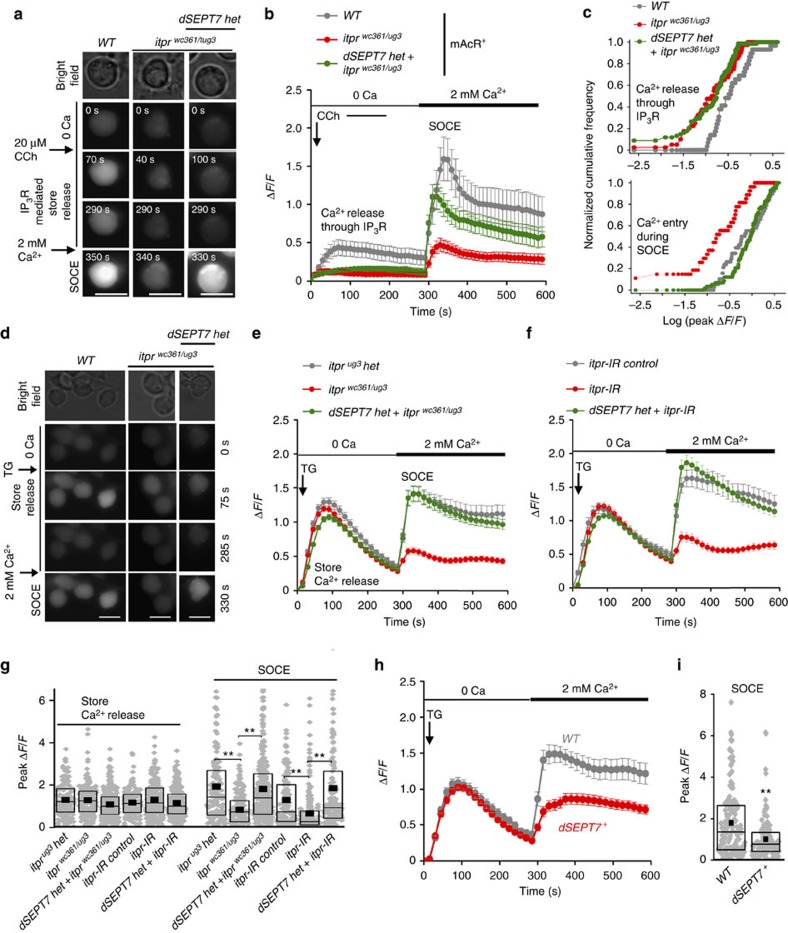
Figure 2. dSEPT7 reduction improves uptake of extracellular Ca2+ in neurons with reduced IP3R function.
(a) Representative images of primary Drosophila larval neurons of the indicated genotypes. Images were obtained before and after carbachol (CCh, 20 μM)-induced ER store Ca2+ release and entry of extracellular Ca2+ by SOCE at the indicated time points. Scale bar, 5 μm. (b) SOCE in itprwc361/ug3 neurons with and without dSEPT7 reduction. Traces represent the mean (±s.e.m.) ΔF/F values obtained at each time point during CCh-induced ER store Ca2+ release and SOCE for the indicated genotypes (N≥70 cells). (c) Kolmogorov–Smirnov (K–S) plots comparing the distribution of peak ΔF/F values obtained during IP3R-mediated Ca2+ release (top) and Ca2+ entry during SOCE (bottom) in the indicated genotypes. P<0.0001, K–S test for itprwc361/ug3 and ‘dSEPT7 het+itprwc361/ug3’ as compared with WT, (top) and itprwc361/ug3compared with WT and ‘dSEPT7 het+itprwc361/ug3’ (bottom). (d) Representative images of primary Drosophila larval neurons of the indicated genotypes with changes in cytosolic Ca2+ levels obtained after ER store depletion by thapsigargin (TG, 10 μM) and entry of extracellular Ca2+ during SOCE. Scale bar, 5 μm. (e,f) Reduced SOCE observed in itprwc361/ug3 neurons (e) and neurons with itpr knockdown (itpr-IR) (f) was restored to control levels on reduction of dSEPT7. itprug3 het (or itprug3/+) refers to animals heterozygous for the ug3 mutation in the itpr gene and is a genotypic control for the itprwc361/ug3 mutant. Pan-neuronal elavC155GAL4 was used to drive expression of the itprRNAi (itpr-IR). itpr-IR control refers to neurons with the RNAi construct, but no GAL4 driver, resulting in the absence of RNAi expression. Traces represent the mean (±s.e.m.) ΔF/F values obtained at each time point after TG-induced ER store Ca2+ depletion and SOCE for the indicated genotypes (N≥150 cells). (g) Quantification of peak ΔF/F values obtained by ER store Ca2+ depletion (0–285 s) and SOCE (300–600 s) for the indicated genotypes; **P<0.001, Mann–Whitney U-test with Bonferroni correction. (h) Reduced SOCE in primary neurons with overexpression of dSEPT7+; N≥150 cells. dSEPT7+ was expressed using the pan-neuronal elavC155 GAL4. (i) Quantification of peak ΔF/F values obtained during SOCE in the indicated genotypes; **P<0.01, Mann–Whitney U-test. Diamonds represent peak ΔF/F values of individual cells.

