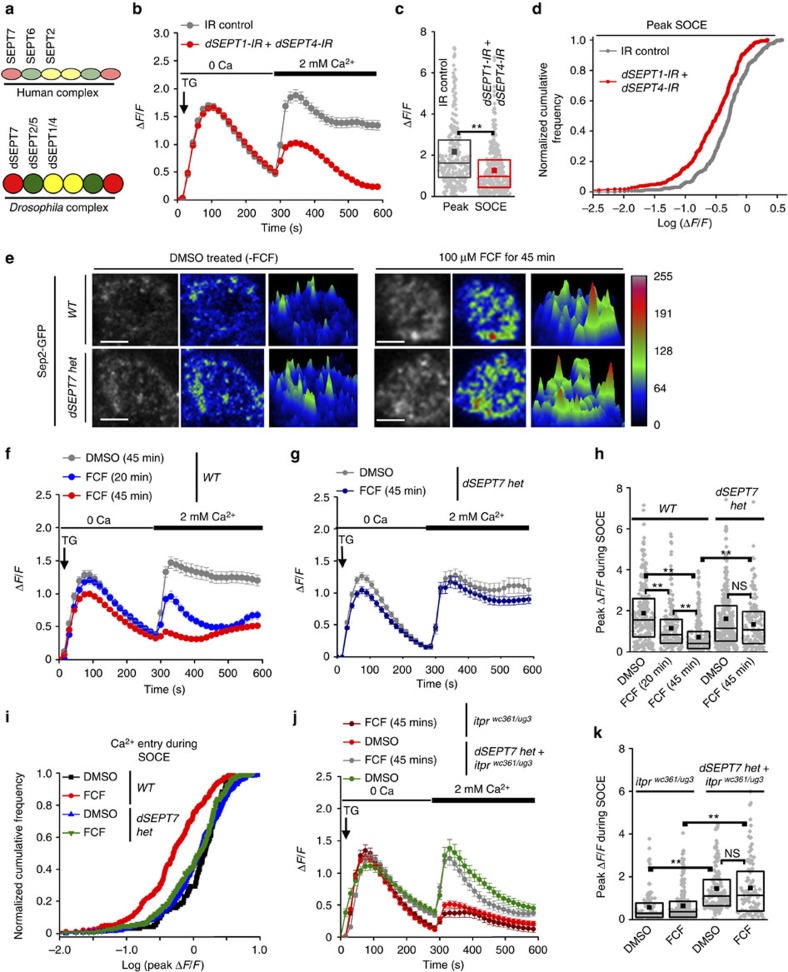
Figure 3. Reducing dSEPT7 restores Ca2+ entry in neurons with pharmacological inhibition of septin dynamics.
(a) Positions occupied by septins of different subgroups (Table 1) in a septin complex formed by human septin subunits and their Drosophila homologues. (b) SOCE after TG-induced depletion of ER stores in neurons with knockdown of dSEPT1 and dSEPT4. IR control refers to neurons carrying RNAi constructs for both genes without the GAL4 driver. N>300 cells for each genotype. (c) Quantification of peak ΔF/F values obtained during SOCE. (d) K–S plots analysing peak ΔF/F values during SOCE in the indicated genotypes. The distribution for neurons with dSEPT1 and dSEPT4 knockdown is significantly shifted to the left compared with the IR control indicating a greater proportion of cells with lower ΔF/F values. P<0.001, K–S test. (e) Sep2-GFP localization in WT and neurons with reduced dSEPT7 treated with either DMSO (control) or 100 μM FCF for 45 min. Original grey scale images have been pseudo-coloured for visualizing the intensity of Sep2-GFP distribution where warmer colours represent higher intensities. A surface plot constructed with the pseudo-coloured image is shown for better resolution. The calibration bar represents the grey scale intensities corresponding to each colour. Scale bar, 3 μm. (f,g) Changes in ΔF/F (corresponding to changes in cytosolic [Ca2+]) during TG (10 μM)-induced passive ER Ca2+ release and SOCE in neurons of the indicated genotypes treated with 100 μM FCF for 20 or 45 min or DMSO for 45 min. N>100 cells. (h) Box plots quantifying peak ΔF/F values during SOCE in neurons of the indicated genotypes with or without FCF treatment; **P<0.001, Mann–Whitney U-test with Bonferroni correction. (i) K–S plots analysing peak ΔF/F values during SOCE in the indicated genotypes and treatment conditions. P<0.0001, K–S test. (j) Changes in cytosolic [Ca2+] indicated as ΔF/F during TG (10 μM)-induced passive ER Ca2+ release and SOCE in neurons of the indicated genotypes and treatment conditions. (k) Box plots quantifying peak ΔF/F values during SOCE in the indicated genotypes; **P<0.001, Mann–Whitney U-test; NS, not significant.

