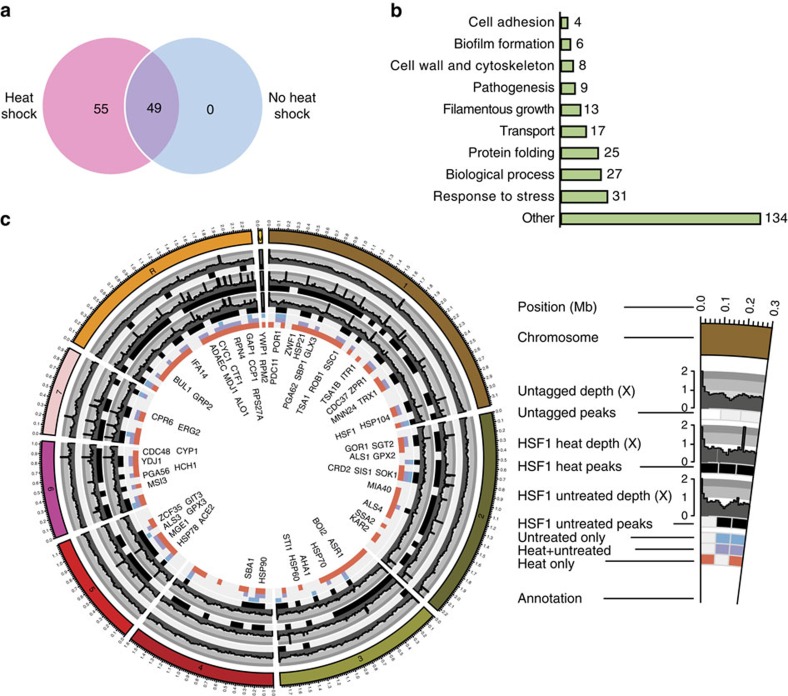
Figure 1. Hsf1 target genes.
(a) Venn diagram depicting number of Hsf1 peaks in the absence (no heat shock, blue) or presence (heat shock, pink) of a 30–42 °C heat shock. (b) GO Slim Mapper analysis was performed on the ChIP-seq data set to identify the processes of all genes bound by Hsf1 in the absence and presence of a 30–42 °C heat shock. Number of Hsf1 target genes represented under each category are indicated. Other categories include, but are not limited to, response to drug, cell cycle, response to chemical, organelle localization, protein catabolic process, translation, ribosome biogenesis, signal transduction and cell development. (c) Circos plot illustrating peaks of genes bound by Hsf1 (systematic names) in the absence and presence of a 30–42 °C heat shock. Each circle from the periphery to the core represents the following: chromosomal location; normalized read depth of peaks from untagged samples, heat shocked samples and untreated samples; key of condition under which the peak is present (untreated, untreated with heat shock and heat shock only); and name of gene bound. All boxes represent ≥1 peak that falls within a 100 kb non-overlapping window.

