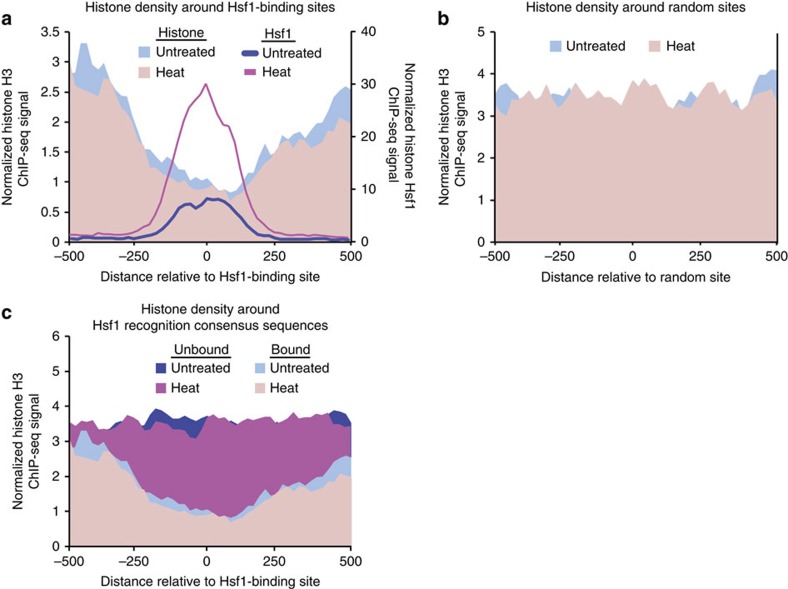
Figure 3. Nucleosome positioning affects Hsf1 DNA binding.
(a,b) Schematic plots illustrating nucleosome density (shaded area) and Hsf1 binding (lines) at (a) Hsf1-binding sites and (b) random genomic regions before (blue) and after (red) heat shock. (c) Nucleosome density around genomic regions containing Hsf1 recognition consensus sequences with (bound) or without (not bound) Hsf1 (as determined by Hsf1-TAP ChIP-seq analysis) before (blue) and after (red) heat shock. Nucleosome and Hsf1-TAP levels were measured by Histone H3 and Hsf1-TAP ChIP-seq, respectively.

