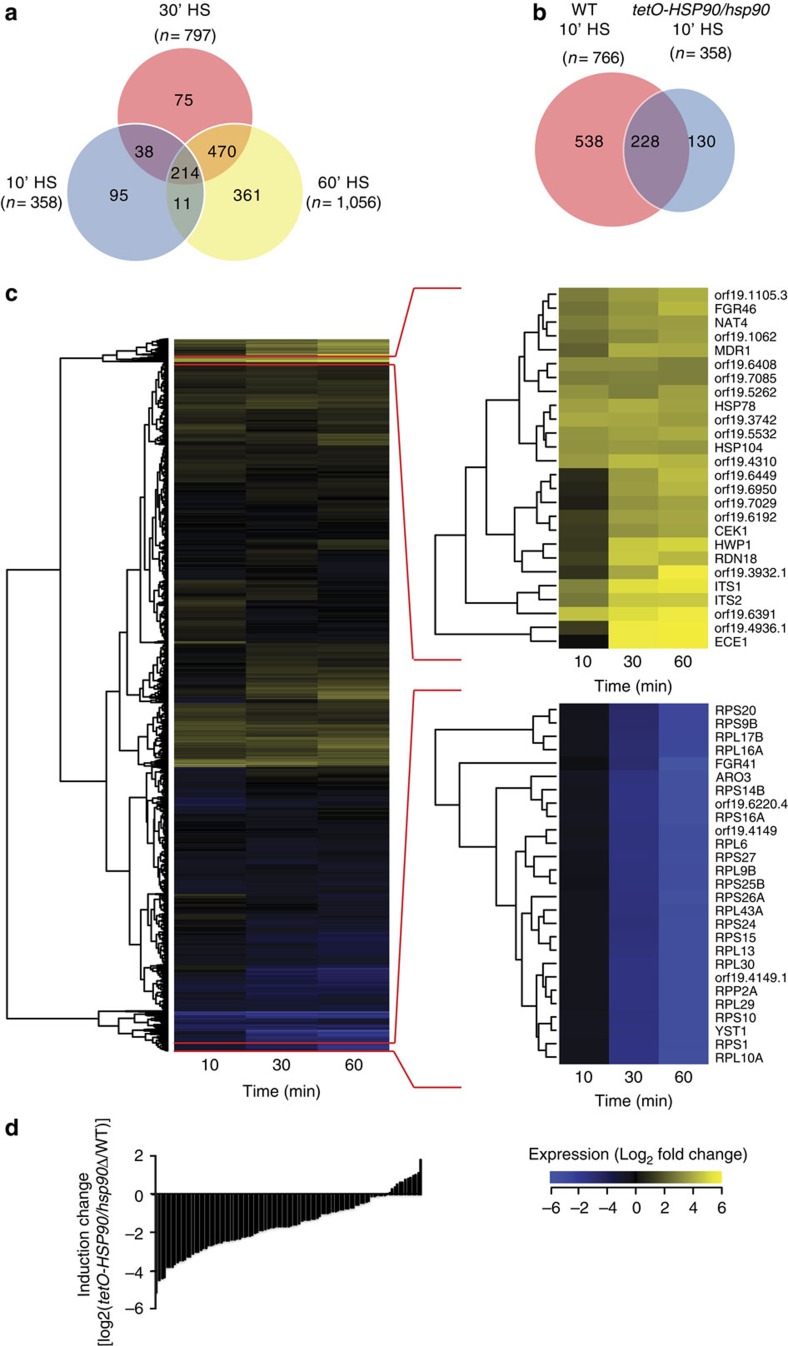
Figure 5. Depletion of Hsp90 changes the genome-wide heat shock signature.
(a) Venn diagram depicting number of upregulated genes 10, 30 and 60 min post 30–42 °C HS in HSP90-depleted cells. Overlap between samples is illustrated, with the total number of genes upregulated at each time point represented under each time point. (b) Venn diagram illustrating gene expression overlap between wild-type and tetO-HSP90/hsp90Δ strains 10 min post 30–42 °C HS. (c) Expression pattern of the tetO-HSP90/hsp90Δ strain grown in the presence of 20 μg ml−1 doxycycline for transcriptional repression of HSP90 compared with the same strain 10, 30 and 60 min post 30–42 °C heat shock. Yellow represents greater than Log2-fold increase in gene expression, blue represents a Log2-fold or greater decrease in gene expression. Columns represent individual time points. (d) Histogram illustrating the effect of HSP90 depletion on heat-induced expression changes of Hsf1 target genes. Transcription induction (increase in PolII level) of Hsf1-target genes upon heat shock in the absence of HSP90 was compared with that in wild-type, and the differences (induction change) are expressed in log2 scale. HS, heat shock.

