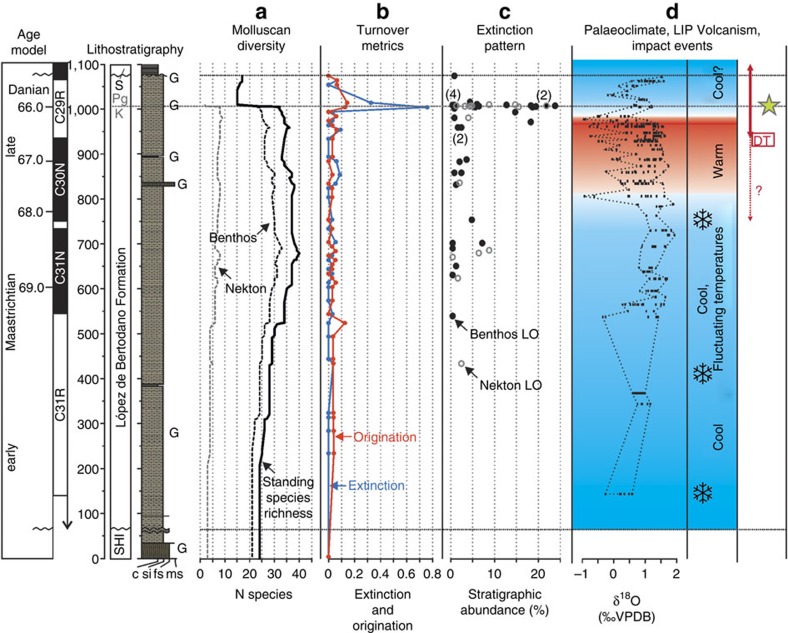
Figure 3. Molluscan diversity and extinction data compared with evidence for Cretaceous–Paleogene palaeoenvironmental change.
(a) Molluscan diversity for benthos (bivalves and gastropods) and nekton (ammonites and nautiloid) measured as standing species richness in the composite section (Supplementary Data 1), plotted against age model and lithostratigraphy. Composite standing species richness for all molluscan groups plotted as solid black line. Note all nektonic molluscan taxa disappear at the K–Pg boundary (grey dashed line, defined by dinoflagellate cyst biostratigraphy and iridium (Ir) anomaly in paralell section16,30,31. All nekton data species richness and extinction data reanalysed from Witts et al.18. (b) Extinction and origination rates through time based on boundary-crosser methodology38, calculated for the entire molluscan fauna (both benthic and nektonic taxa) in 10 m bins (Methods and Supplementary Data 1). See Supplementary Fig. 6 for metrics calculated for benthos and nekton individually. (c) Analysis of extinction pattern based on ‘Meldahl's method'40,41 with last occurrences (LO) in the composite section plotted against stratigraphic abundance S (measured as a %), separated into benthos (bivalves and gastropods) and nekton (ammonites and nautiloid). Numbers in parentheses indicate number of overlapping data points (that is, where taxa have the same value of S). Data are consistent with a single mass extinction event affecting common molluscan taxa (those with a higher value of S) coincident with the K–Pg boundary. (d) Palaeoclimate interpretation based on published data from multiple sections on Seymour Island17,23,51,65. Snowflake symbols are ‘cold snaps' of Bowman et al.23, red arrow labelled DT, approximate duration of the main phase of Deccan Trap volcanism (correlated to section and age model using magnetostratigraphy, based on Schoene et al.12 and Renne et al.13). Dashed red line and ? illustrates uncertainty surrounding the timing of initial onset of Deccan volcanism12,70. Yellow star, position of Ir anomaly at the K–Pg boundary in a parallel section30 taken as a global marker of the Chicxulub impact event32 (see Supplementary Figs 6 and 7 for further information).

