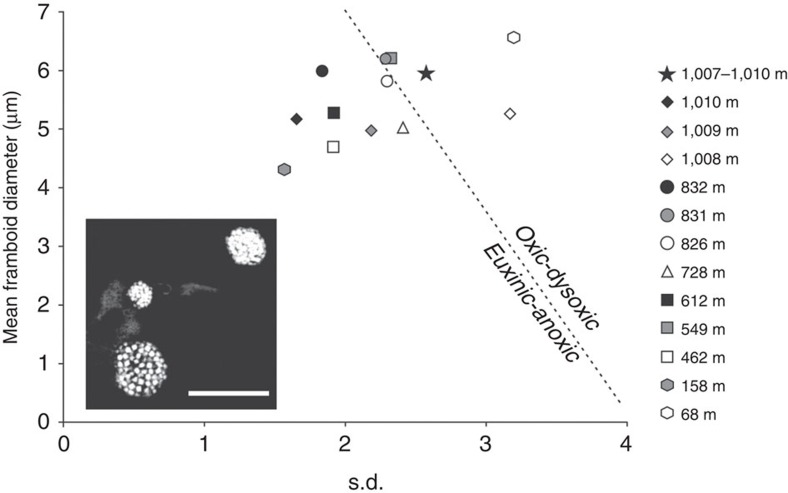
Figure 4. Mean versus s.d. plot of framboid populations from the López de Bertodano Formation.
Samples ordered stratigraphically in composite section. Dashed line separates redox conditions and is based on modern calibration46. Samples plot in both oxic–dysoxic and anoxic–euxinic fields, indicating rapid redox fluctuations. Inset represents pyrite framboids from sample D5.481.2 (158 m). Scale bar, 10 μm. See Supplementary Fig. 8 and Supplementary Table 2 for more detailed information.

