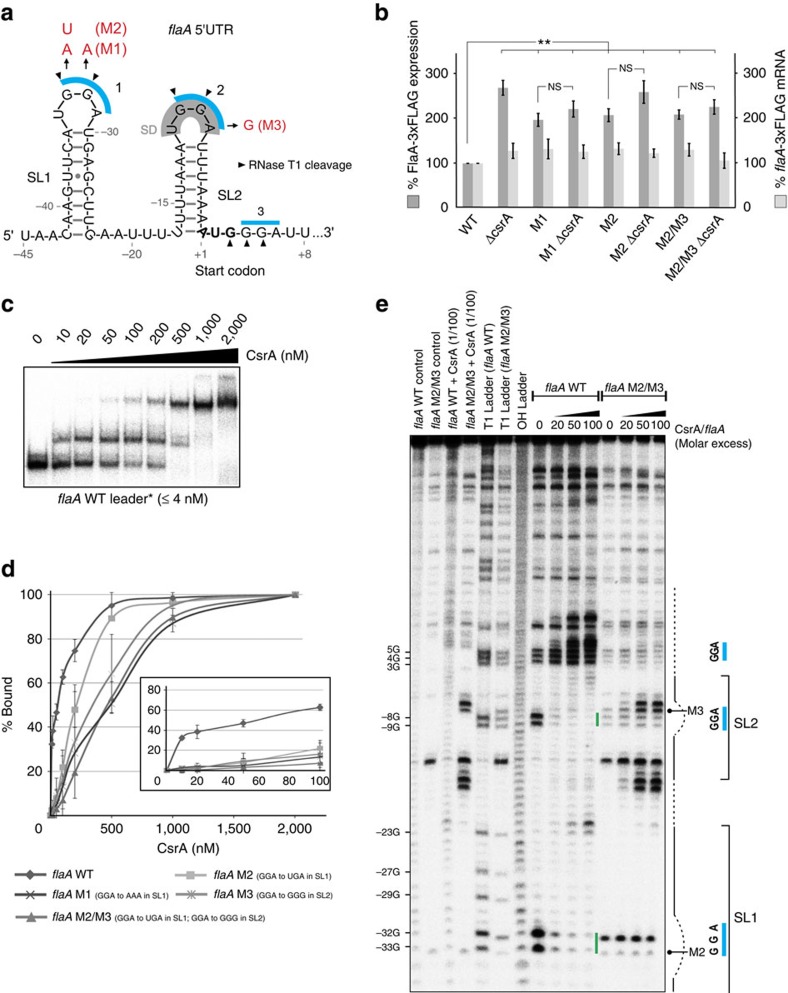
Figure 2. CsrA represses flaA translation by binding to its 5′UTR.
(a) Predicted secondary structure of the flaA leader using Mfold74. Blue bars indicate GGA motifs; grey: SD sequence. Black triangles indicate RNase T1 cleavages from the structure probing in c. (b) Western blot quantification (n=5 biological replicates) of FlaA with a C-terminal 3xFLAG epitope tag integrated at its native locus (FlaA-3xFLAG) and northern blot analysis of flaA mRNA (n=3 biological replicates) in ΔcsrA and various flaA 5′UTR mutant strains. Shown is the mean±s.e.m (**P<0.01 using Student's t-test, NS: not significant). Mutations are depicted in red in a. (c) Gel-shift assays using ∼0.04 pmol in vitro-transcribed and 5′ end-labelled flaA leader (−45 to +99 relative to the start codon) with increasing concentrations of CsrA. (d) Affinity binding curves determined by gel-shift assays for 32P-labelled flaA WT and mutant leaders (≤4 nM) based on three replicates. The inset represents an enlargement of the binding curves for low CsrA concentrations. Shown is the mean±s.d. (e) Footprinting assays of ∼0.2 pmol 32P-labelled flaA WT and flaA M2/M3 mutant leaders in the absence or presence of increasing CsrA concentrations (molar excess of 0, 20, 50 and 100 CsrA) using RNase T1. Untreated flaA leader alone or incubated with 100-fold excess of CsrA served as controls and RNase T1- or alkali (OH)-digested flaA leader as ladders, respectively. Blue lines: GGA motifs; green lines: protection from RNA cleavage upon addition of CsrA. The secondary structure of the flaA leader according to a is depicted on the right.

