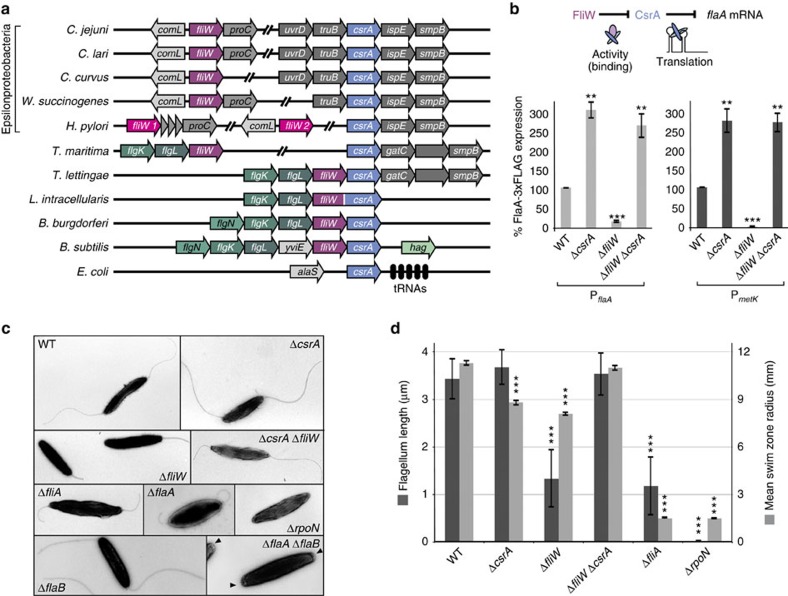
Figure 3. The flagellar assembly factor FliW binds and antagonizes CsrA.
(a) Genomic context of csrA and fliW homologues in diverse bacterial species (Campylobacter spp: C. jejuni, C. lari, C. curvus; Wolinella succinogenes; Helicobacter pylori; Thermotogales: T. maritima, T. lettingae; Lawsonia intracellularis; Borrellia burgdorferi; Bacillus subtilis; Escherichia coli). Blue: csrA homologs; dark or light red: fliW homologues; shades of green: flagellar genes. (b) (Top) Scheme of the antagonizing effect of FliW on CsrA-mediated translational repression of flaA mRNA by direct binding of FliW to CsrA. (Bottom, left) Quantification of FlaA-3xFLAG using western blot in C. jejuni WT, ΔcsrA, ΔfliW and ΔcsrA/ΔfliW strains in mid-log phase (n=3 biological replicates). Plotted is the mean±s.e.m (**P<0.01, ***P<0.001 using Student's t-test). (Bottom, right) Quantification of FlaA-3xFLAG using western blot in WT, ΔcsrA, ΔfliW and ΔcsrA/ΔfliW strain backgrounds where the flaA promoter has been exchanged with the constitutive metK promoter. Please note that FlaA-3xFLAG levels expressed from the PmetK promoter represent ∼70% compared with the expression from its native PflaA promoter. (c) Transmission electron micrographs of indicated strains harvested from MH agar. Black triangles indicate hook structures. (d) Average flagella length (dark grey bars) of indicated strains from transmission electron micrographs using ImageJ (n>25 measurements). Plotted is the mean±s.d. (***P<0.001 versus WT using Student's t-test). Motility was measured as average swimming distance (light grey bars) in soft agar. Bars show the mean±s.e.m (***P<0.001 versus WT using Student's t-test).

