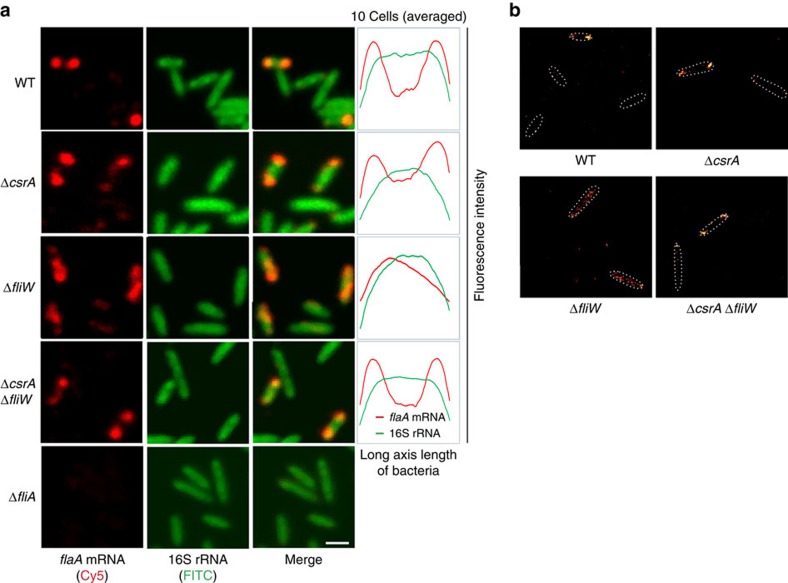
Figure 7. CsrA and FliW influence flaA mRNA localization to the poles.
(a) RNA-FISH analysis (Left: confocal microscopy images; Right: averaged fluorescence intensity along the long axis based on 10 cells) of 16S rRNA (green) and flaA mRNA (red) in C. jejuni NCTC11168 WT, ΔcsrA, ΔfliW, ΔcsrA/ΔfliW and ΔfliA strains in mid-log phase. FITC and Cy5 channels were merged in the microcopy images in the third lanes (scale bar, 1 μm). (b) Super-resolution microscopy imaging of flaA mRNA RNA-FISH (14 Cy5-labelled oligos) in the indicated C. jejuni strains using dSTORM imaging. Cell boundaries from bright-field images are depicted by white dotted lines.

