Figure 4.

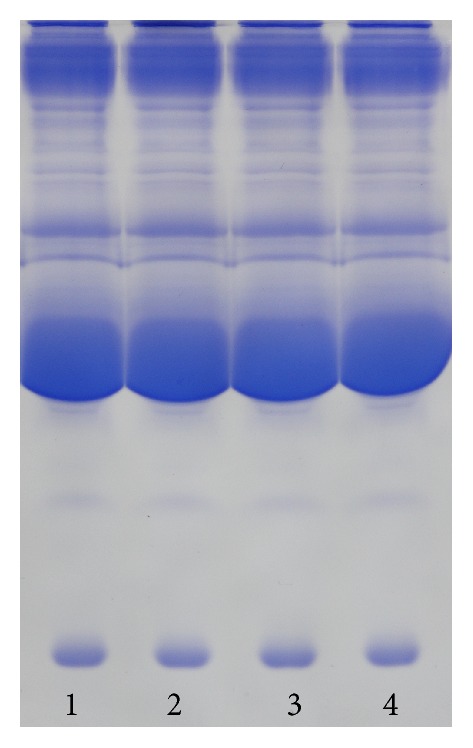
Results of serum protein gel electrophoresis. Numbers 1, 2, and 3 correspond to the ID50 concentrations of potassium permanganate, iodine, and hydrogen peroxide, respectively. Number 4 is the control group.

Results of serum protein gel electrophoresis. Numbers 1, 2, and 3 correspond to the ID50 concentrations of potassium permanganate, iodine, and hydrogen peroxide, respectively. Number 4 is the control group.