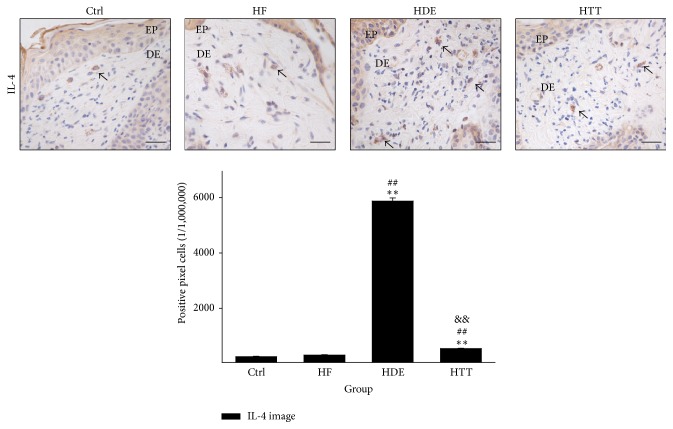
Figure 3.
The regulation of Th2 differentiation. IL-4-positive reaction (arrow indicates dark brown) decreased in the HTT group compared with the HDE group (IL-4 immunohistochemistry; bar size, 50 μm). Data of IL-4 image analysis was also showing the same result (p < 0.01). Ctrl: normal feeding, HF: high-fat diet, HDE: high-fat diet and untreated AD-induced, HTT: high fat diet and Hataedock treated AD-induced, EP: epidermis, and DE: dermis. ∗∗ p < 0.01, compared with the Ctrl group; ## p < 0.01, compared with the HF group; && p < 0.01, compared with the HDE group.

