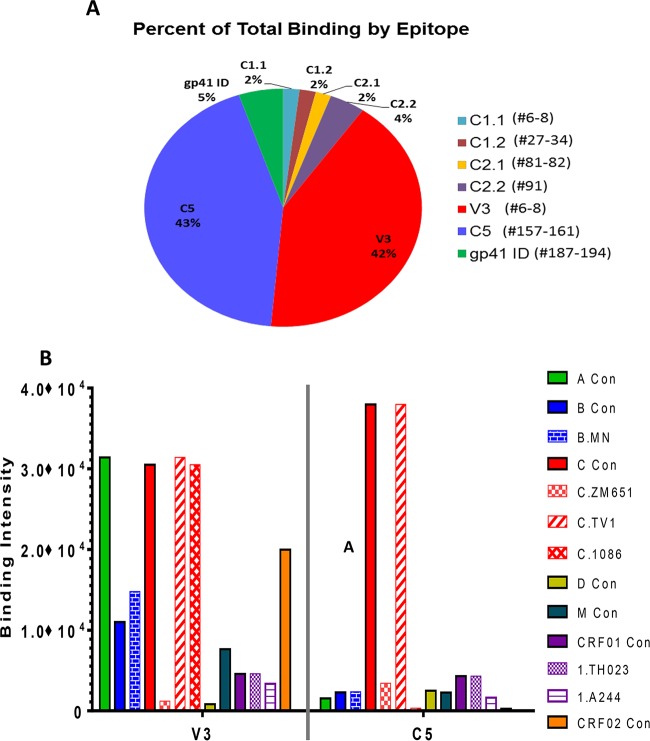
FIG 5.
Linear epitope-specific response measured by peptide microarray. (A) Proportions of linear binding responses to each epitope region. The peptide region for each epitope is listed as the peptide numbers in the array library in parentheses next to the name of the epitope. Sequences of all peptides in the microarray library have been published previously (15). For each subject, the percentage values for each epitope are calculated as follows: maximum binding to the epitope/sum of maximum binding to all epitopes. Each pie slice represents the average value for all subjects (n = 12) mapped in the study. (B) Clade/strain preferences of the two dominant specificities (V3 and C5). Magnitudes of binding (maximum binding intensities) to V3 and C5 peptides of each clade/strain are plotted. Each bar represents the average value of the results for all 12 subjects mapped.

