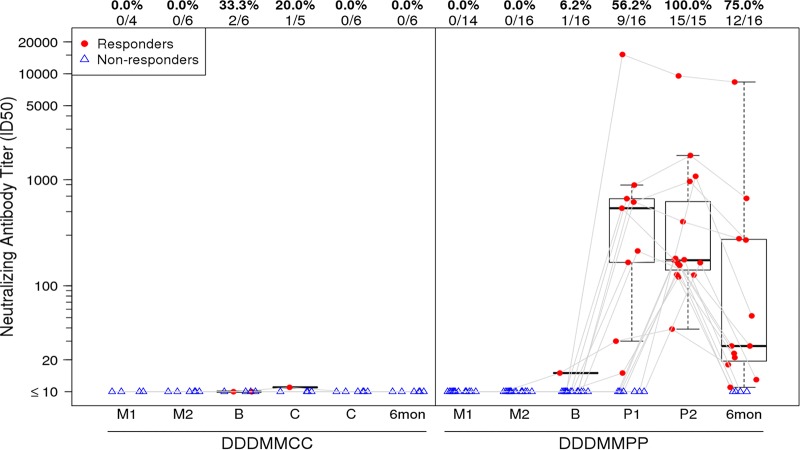
FIG 6.
Neutralization 50% tissue culture infective dose (ID50) titers in the TZM-bl cell assay against the MW965.26 HIV-1C virus. The titer distributions for each treatment group are shown by time point, from samples obtained 2 weeks after the first MVA vaccination (M1), 2 weeks after the second MVA vaccination (M2), at extension baseline (B) prior to the first injection with gp140 or placebo, 2 weeks after each study extension injection, and 6 months after the final injection. Participants received either placebo (DDDMMCC group) or protein (DDDMMPP). Numbers at the top of each panel show the percentage and number of responders from each group among the evaluable participants. Plots include data from responders in red and nonresponders in blue. Box plots show the distribution of the magnitude of response in positive responders only; the midline denotes the median, and the ends of the box denote the 25th and 75th percentiles. Whiskers extend to the most extreme data points within 1.5 times the interquartile range.

