FIG 2.
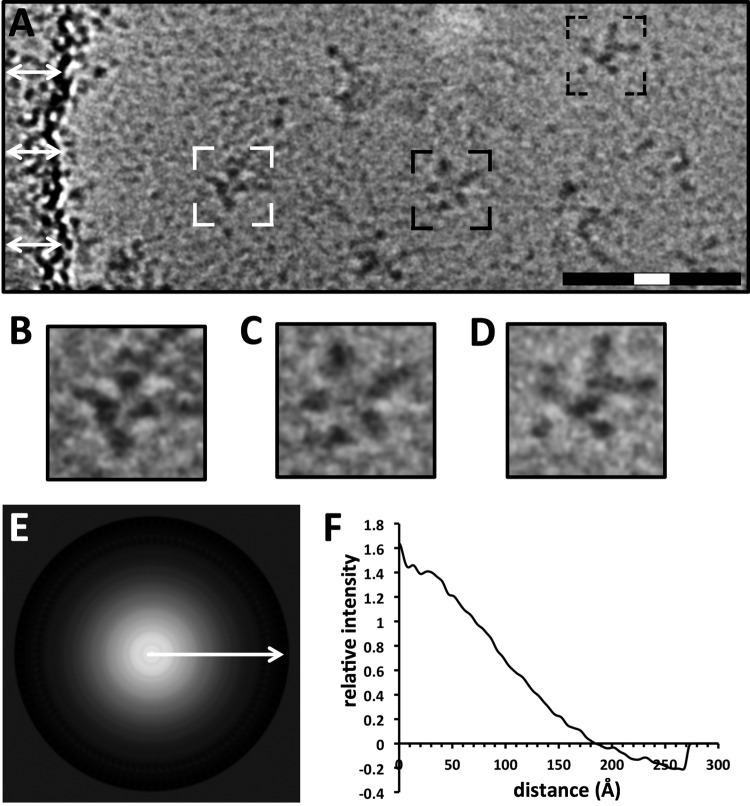
Analysis of Anhui H7 virus HA by cryo-electron microscopy and image analysis. (A) Image of a field of HA complexes of the Anhui H7 virus observed by cryo-electron microscopy in vitreous ice. White arrows indicate the edge of the carbon film substrate. Black areas represent density contrast. The HA complexes shown in panels B to D are outlined. Full bar, 100 nm; white portion of bar, 20 nm. (B to D) Zoom-in views of HA complexes, with dot-shaped and bar-shaped densities representing mostly apical (top view) (B), apical and lateral (side view) (C), and lateral (D) orientations of HA complexes. (E) Circular average of HA complexes from cryo-electron microscopic images. The signal is represented as positive (white). The arrow indicates the direction of the subsequent profile analysis of the radius. (F) One-dimensional radial profile of the circular average, used to estimate the relative diameter of the particle population.

