FIG 3.
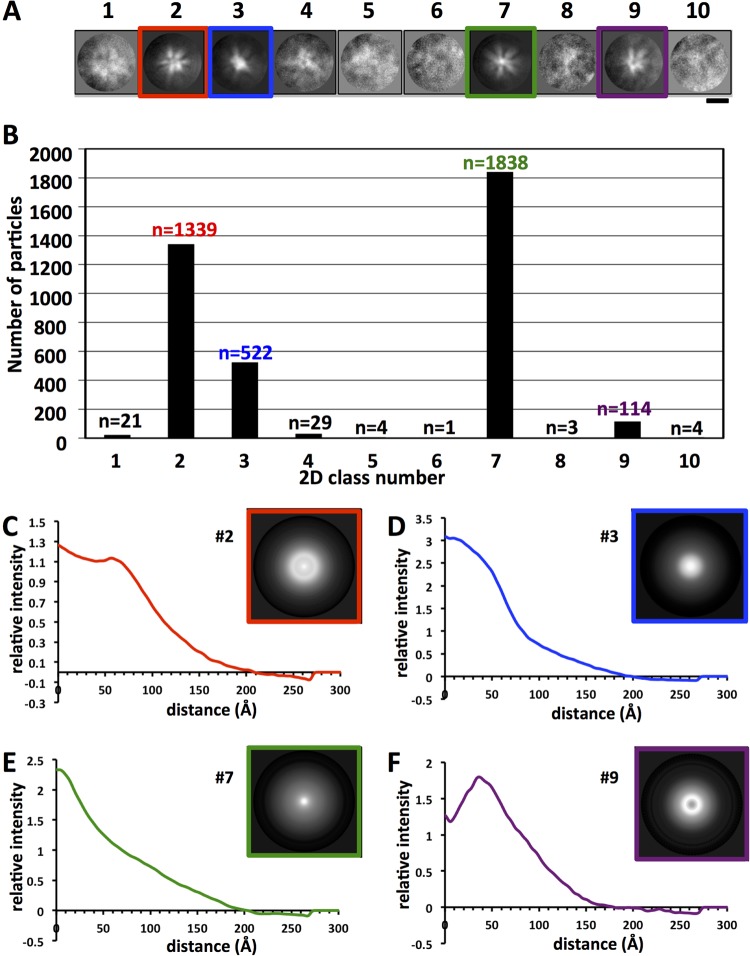
Analyses of HA complexes by 2D image classification and radial profile curves. (A) Gallery of 10 reference-free 2D classes derived from computational analysis of cryo-electron microscopic images of HA complexes (n = 3,875). The most populated structural classes are framed in red, blue, green, or purple. Bar, 20 nm. Protein is shown in white. (B) Distribution of 3,875 individual HA complexes assigned by computational analysis to the 10 2D classes. The number of complexes in each class is given above the bar. (C to F) One-dimensional profile curves of the four most populated 2D classes, classes 2, 3, 7, and 9, respectively. The profile curve is the radial density intensity trace from the circular average (inset) of each class, used to measure the relative diameter and density distribution of each class.

