FIG 4.
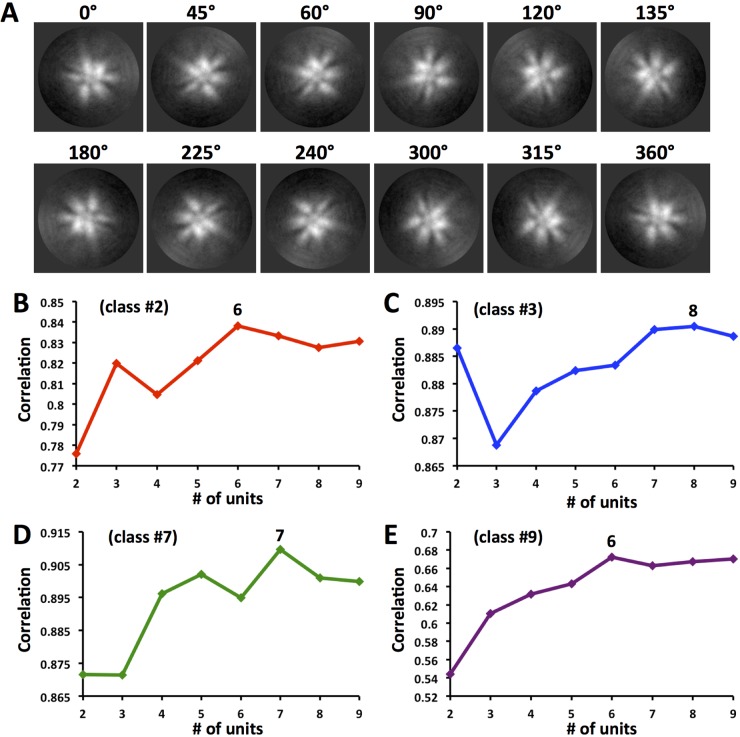
Estimation of the number of protruding appendages (units) per 2D class of HA complexes by image rotation and correlation. (A) Montage of some representative images from the rotation image library for class 2 of the HA complex. Images are rotated by degree increments as shown above each panel. Protein is represented as white. (B to E) Average correlation curves of HA complexes of 2D classes 2, 3, 7, and 9, shown in red, blue, green, and purple, respectively. Rotated images calculated to have increasing numbers of units (asymmetric units per 360°) are correlated. The maximum correlation peak denotes the optimal number of protruding appendages (units) for that 2D class of HA complex. The correlation maximum (6, 8, 7, or 6 units) is given above the analysis curve for each class.

