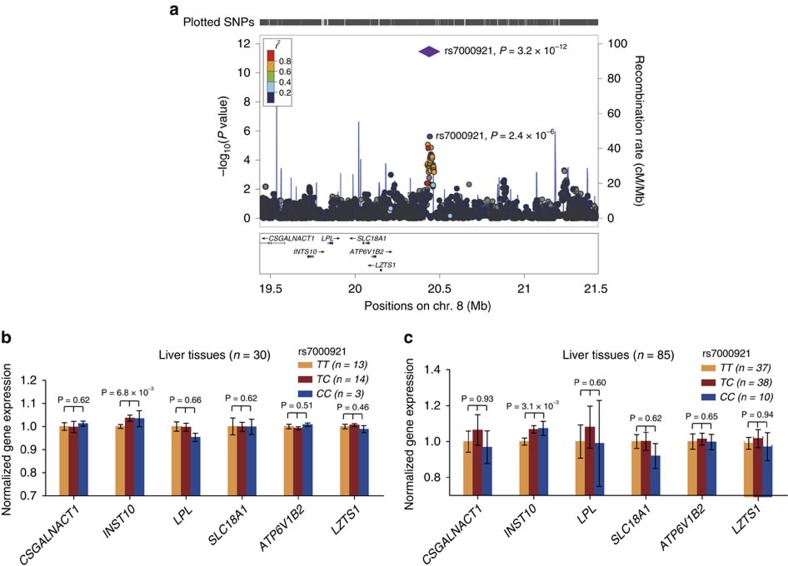
Figure 1. rs7000921 are significantly associated with persistent HBV infection and rs7000921 is associated with the mRNA levels of INST10in liver tissues.
(a) The genetic association results were shown for SNPs in the region 1-Mb up- or downstream of the index SNP rs7000921. Genomic positions are based on NCBI Build 36. In the meta-analysis, the P value of rs7000921 is shown as purple diamonds, with their initial P value in the GWAS stage shown as purple dots. The LD values (r2) to rs7000921 for the other SNPs are indicated by marker colour. Red signifies r2≥0.8, orange 0.6≤r2<0.8, green 0.4≤r2<0.6, light blue 0.2≤r2<0.4 and blue r2<0.2. Estimated recombination rates (from the HapMap project phase II) are plotted in light blue. Genes within the region surrounding rs7000921 are annotated, with the positions of transcripts shown by arrows. (b,c) The mRNA expression levels of nearby genes in subjects with different rs7000921 genotypes (CC, CT and TT) were shown. The mRNA expression levels were log2 transformed. Expression levels of each gene were normalized to the mean level of homozygotes for the major allele of rs7000921 (TT genotype) in 31 (b) or 88 (c) human liver tissue samples. Among the 31 liver samples, one sample failed to be genotyped for the rs7000921, thus the analyses were only restricted in the remaining 30 samples. Among the 88 liver samples, three subjects were considered as outliers (their mRNA levels of INTS10>mean+3 s.d. or <mean −3 s.d.), thus the analyses were restricted in the remaining 85 samples. P values were derived from linear regression analyses, and were considered to be significant when below 0.05 after Bonferroni correction by multiplying the number of comparisons. Error bars indicate s.e.m.

