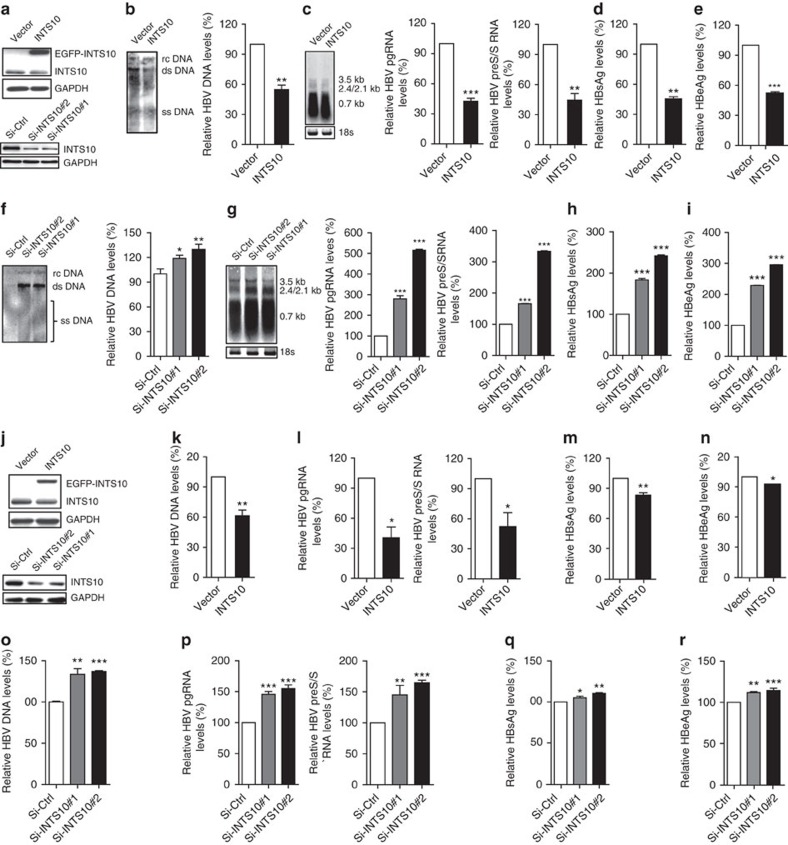
Figure 2. INTS10 suppresses HBV replication in L02 and HepG2.2.15 cells.
(a) Protein levels of INTS10 in cellular lysates of L02 cells. L02 cells (∼2 × 10⁵) were transfected with pAAV-HBV1.2 vectors, together with pLV-EGFP-INTS10 vector (INTS10) or pLV-EGFP control vector(Vector) (up) or with INTS10-specific siRNAs (Si-INTS10#1 and Si-INTS10#2) or non-targeting scrambled siRNA (Si-Ctrl) (down). (b,c) Levels of HBV DNAs (b), 3.5 Kb pregenomic RNAs (pgRNAs) and 2.4/2.1 Kb Pre-S/S RNAs (c) in L02 cells with INTS10 overexpression. (d,e) Levels of HBsAg (d) and HBeAg (e) in supernatants of L02 cells with INTS10 overexpression. (f,g) Levels of HBV DNAs (f), pgRNAs and Pre-S/S RNAs (g) in L02 cells with INTS10 knockdown. (h,i) Levels of HBsAg (h) and HBeAg (i) in supernatants of L02 cells with INTS10 knockdown. (j) Protein levels of INTS10 in cellular lysates of HepG2.2.15 cells. HepG2.2.15 cells (∼2 × 10⁵) were transfected with INTS10 or control vectors (up), or with INTS10-specific or control siRNAs(down). (k,l) Levels of HBV DNAs (k), pgRNAs and Pre-S/S RNAs (l) in HepG2.2.15 cells with INTS10 overexpression. (m,n) Levels of HBsAg (m) and HBeAg (n) in supernatants of HepG2.2.15 cells with INTS10 overexpression. (o,p) Levels of HBV DNAs (o), pgRNAs and Pre-S/S RNAs (p) in HepG2.2.15 cells with INTS10 knockdown. (q,r) Levels of HBsAg (q) and HBeAg (r) in supernatants of HepG2.2.15 cells with INTS10 knockdown. All the supernatants and cells were collected 72 h post-transfection. Protein levels of INTS10 were examined by western blot analyses. HBV DNA levels in cells were measured by Southern blot analysis (left) and quantitative real-time PCR (qRT-PCR; right). The pgRNAs and Pre-S/S RNAs of HBV in cells were measured by northern blot analysis with 18S ribosome RNA (rRNA) indicating RNA loading in each lane (left), and qRT-PCR normalized to human β-actin gene ACTB (right). The levels of HBsAg and HBeAg in supernatants were measured by enzyme-linked immunosorbent assays (ELISA). Error bars indicate s.d. P values were determined using two-tailed unpaired t-test. *P<0.05, **P<0.01 and ***P<0.001. rcDNA, relaxed circular DNA; dsDNA, double-stranded DNA; ssDNA, single-stranded DNA.

