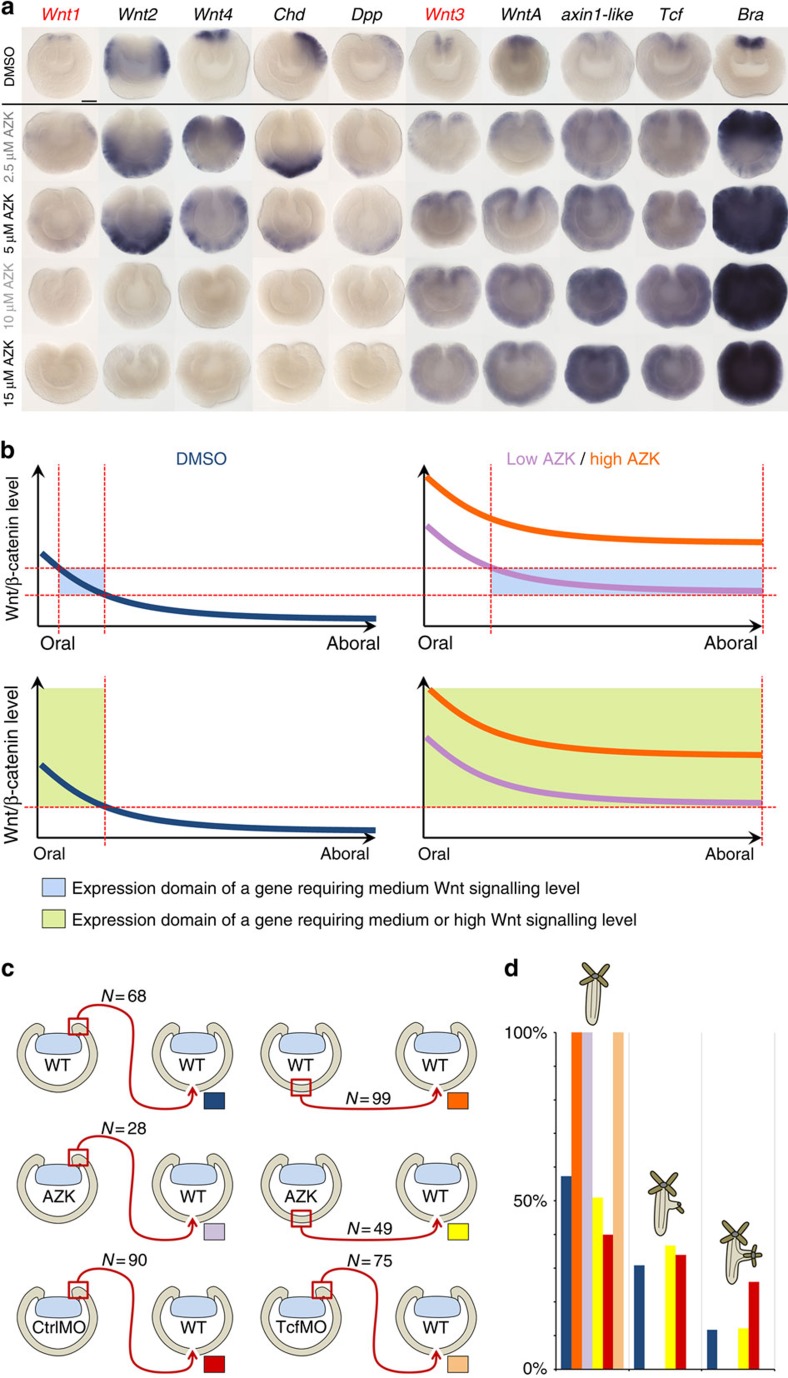
Figure 3. Organizer capacity shifts to follow changes in Wnt1 and Wnt3 expression.
(a) Expression of Wnt1, Wnt2, Wnt4, Chd and Dpp expands aborally while clearing from the oral domain and disappears with the increasing AZK concentrations; expression of Wnt3, axin1-like, Tcf and Bra expands globally and reaches saturation. Blastopores point up; scale bar: 50 μm. (b) Model of expression of a gene activated at medium Wnt/β-catenin signaling levels (upper row; blue highlight represents the range of Wnt/β-catenin signaling levels when the gene can be expressed) versus a gene activated at medium and high Wnt/β-catenin signaling levels (lower row; green highlight represents the range of Wnt/β-catenin signaling levels when the gene can be expressed) in the AZK treatments. Blue curve: wild type level of Wnt/β-catenin signaling along the oral-aboral axis. Lilac curve: Wnt/β-catenin signaling level in a low concentration of AZK. Orange curve: Wnt/β-catenin signaling level in a high concentration of AZK. Red dashed lines mark the Wnt/β-catenin signaling thresholds and the corresponding positions on the oral-aboral axis where these thresholds are reached. (c,d) Scheme (c) and developmental outcomes (d) of transplantation of wild type (wt) and 2.5 μM AZK treated (AZK) blastopore lips and aboral ectoderm fragments as well as blastopore lips of the CtrlMO and TcfMO injected gastrulae into wild type recipient gastrulae. Coloured rectangles on (c) correspond to the colours of the bars on (d). Only untreated or CtrlMO blastopore lips and AZK treated aboral ectoderm fragments are inductive.

