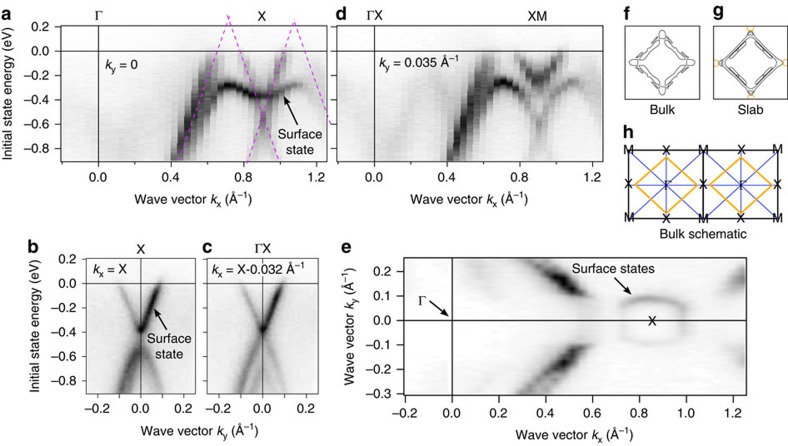
Figure 3. Band structure measured with ARPES.
(a) Band structure along ΓX. The purple lines represent the predicted bulk bands. In addition a surface state is visible. (b) Band structure along MXM and parallel to MXM (c). Along the high symmetry line the band structure is gapped (b) but with a much smaller gap than predicted in the bulk calculation. The gap closes and a cone forms parallel to the high symmetry line (c). (d) Band structure parallel to ΓX. Due to the gapping of the surface state it can be inferred that it is hybridized with the bulk cone at X. (e) Constant energy plot at the Fermi energy. (f–h) The lower drawing (h) sketches the predicted Fermi surface and compares calculated bulk and slab Fermi surfaces (f,g). Pockets that are clearly surface-derived are drawn in orange. The measured Fermi surface displays the predicted slab Fermi surface well.

