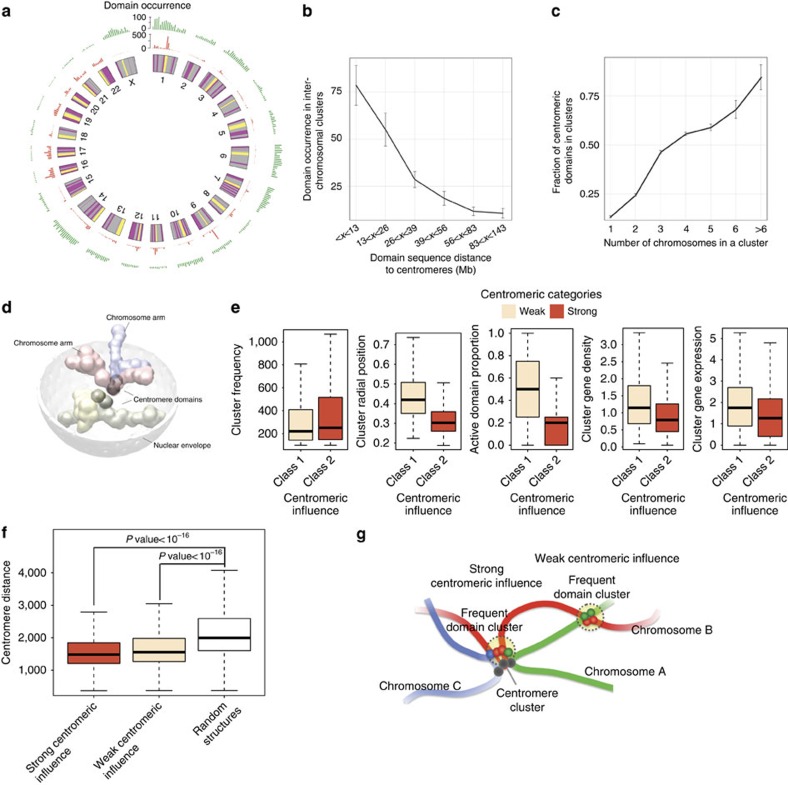
Figure 4. Centromeric influence on spatial clusters.
(a) Domain occurrence in frequent spatial clusters. The full set of chromosomes is represented as the circular plot, where centromeric domains are coloured as yellow, active domains are coloured as red and inactive/other domains are coloured as grey. (b) A plot measuring the correlation between linear centromeric distance and domain occurrence in inter-chromosomal clusters. Data are shown as mean±s.d. of the mean. The number of domains in each group is 73, 72, 72, 73, 72 and 72. (c) A plot showing the correlation between the number of chromosomes in a cluster and the fraction of centromeric domains in the cluster. Data are shown as mean±s.d. of the mean. The number of clusters in each group is 749, 834, 1059, 972, 192, 36 and 14. (d) Illustration of centromere–centromere clustering. (e) Box plots comparing the characteristics of inter-chromosomal clusters with strong and weak centromeric influence, in terms of frequency, radial position, active domain proportion, gene density (the number of genes per 100 kb) and gene expression. (f) Box plots comparing centromere distance between three groups: clusters with strong centromeric influence, clusters with weak centromeric influence and clusters with weak centromeric influence that in random structures. (g) Illustration of inter-chromosomal clusters with strong and weak centromeric influence.

