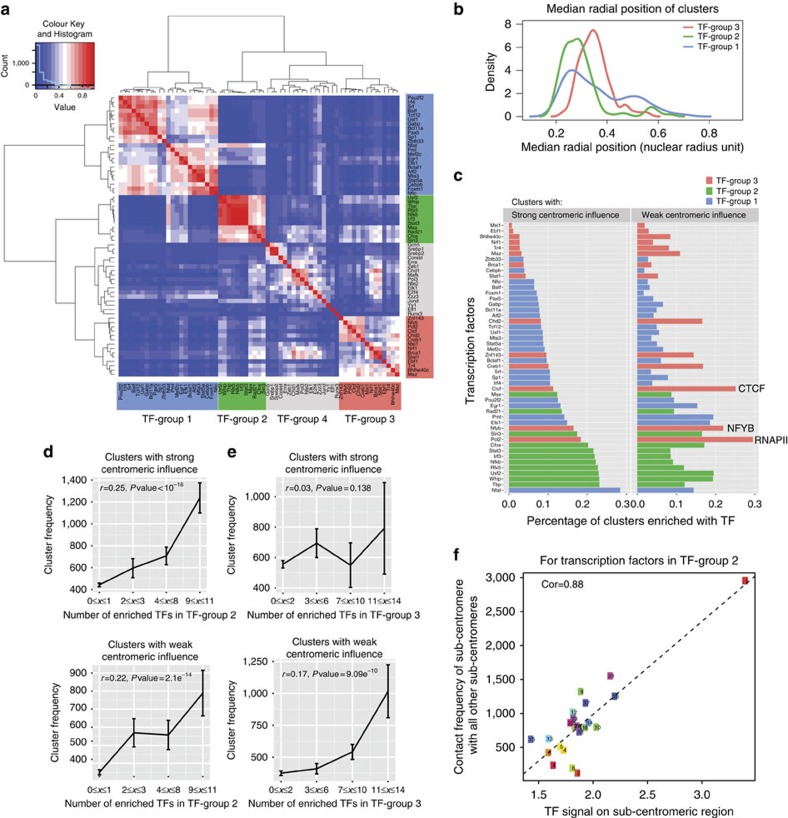
Figure 5. Transcription factors stabilization effects on spatial clusters.
(a) About 65 TFs are classified into 4 groups based on their enrichment profiles across all inter-chromosomal clusters. (b) Radial position distributions of inter-chromosomal clusters exclusively enriched with individual TF-group. (c) Comparison of inter-chromosomal clusters with strong versus weak centromeric influence, in terms of the percentages of clusters enriched in TFs from different TF groups. (d) Correlation plot between cluster frequency and the number of enriched TFs in Group 2 with strong/weak centromeric influence. Data are shown as mean±s.d. of the mean. For clusters with strong centromeric influence, the number of clusters in each group is 339, 60, 230 and 220. For clusters with weak centromeric influence, the number of clusters in each group is 257, 69, 89 and 94. (e) Correlation plot between cluster frequency and the number of enriched TFs in Group 3 with strong/weak centromeric influence. Data are shown as mean±s.d. of the mean. For clusters with strong centromeric influence, the number of clusters in each group is 1,609; 207; 47 and 18. For clusters with weak centromeric influence, the number of clusters in each group is 958, 137, 94 and 37. (f) Correlation plot between the Group 2 TF signals on sub-centromeric regions and the subcentromere–subcentromere contact frequencies.

