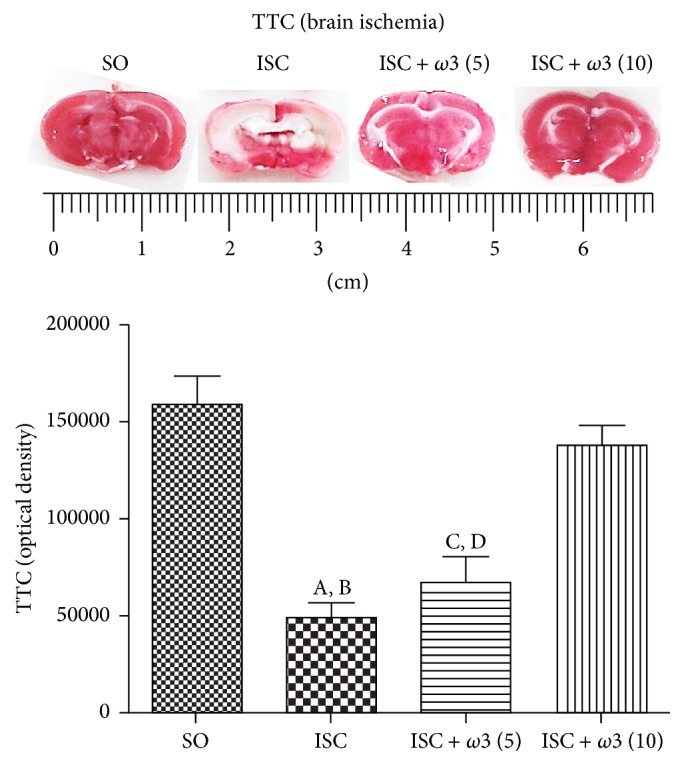
Figure 4.

Effects of ω3 treatments in ischemic groups, visualized by the 2,3,5-triphenyltetrazolium chloride (TTC) staining as related to the SO group. (A) versus SO, q = 9.546∗∗∗; (B) versus ISC + ω3 (10), q = 8.194∗∗∗; (C) versus SO, q = 7.894∗∗∗; (D) versus ISC + ω3 (10), q = 6.452∗∗∗ (one-way ANOVA and Newman-Keuls test as the post hoc test).
