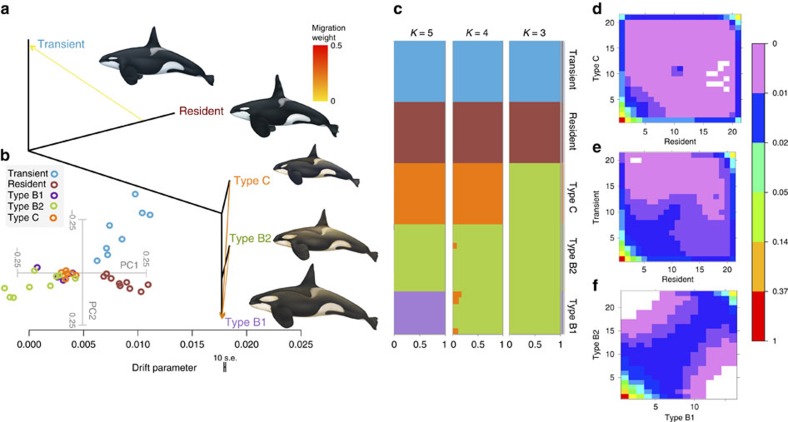
Figure 2. Evolutionary relationships among killer whale ecotypes.
(a) TreeMix maximum likelihood graph from whole-genome sequencing data, rooted with the ‘transient' ecotype. Horizontal branch lengths are proportional to the amount of genetic drift that has occurred along that branch. The scale bar shows 10 times the average s.e. of the entries in the sample covariance matrix. Migration edges inferred using TreeMix and supported by the f3 statistic test are depicted as arrows coloured by migration weight. (b) PCA, both the first and second principal components were statistically significant (P-value <0.001). (c) Ancestry proportions for each of the 48 individuals conditional on the number of genetic clusters (K=3–5). (d–f) Joint site frequency spectra for pairwise comparisons illustrating the speciation continuum. Each entry in the matrix (x,y) corresponds to the probability of observing a SNP with frequency of derived allele x in population 1 and y in population 2. The colours represent the probability for each cell of the SFS, white cells correspond to a probability of zero. The analysis illustrates that the amount of genetic differentiation is greater between (d) Pacific and Antarctic populations and (e) the pair of Pacific types than (f) among the evolutionarily younger Antarctic types, which have highly correlated site frequency spectra.

