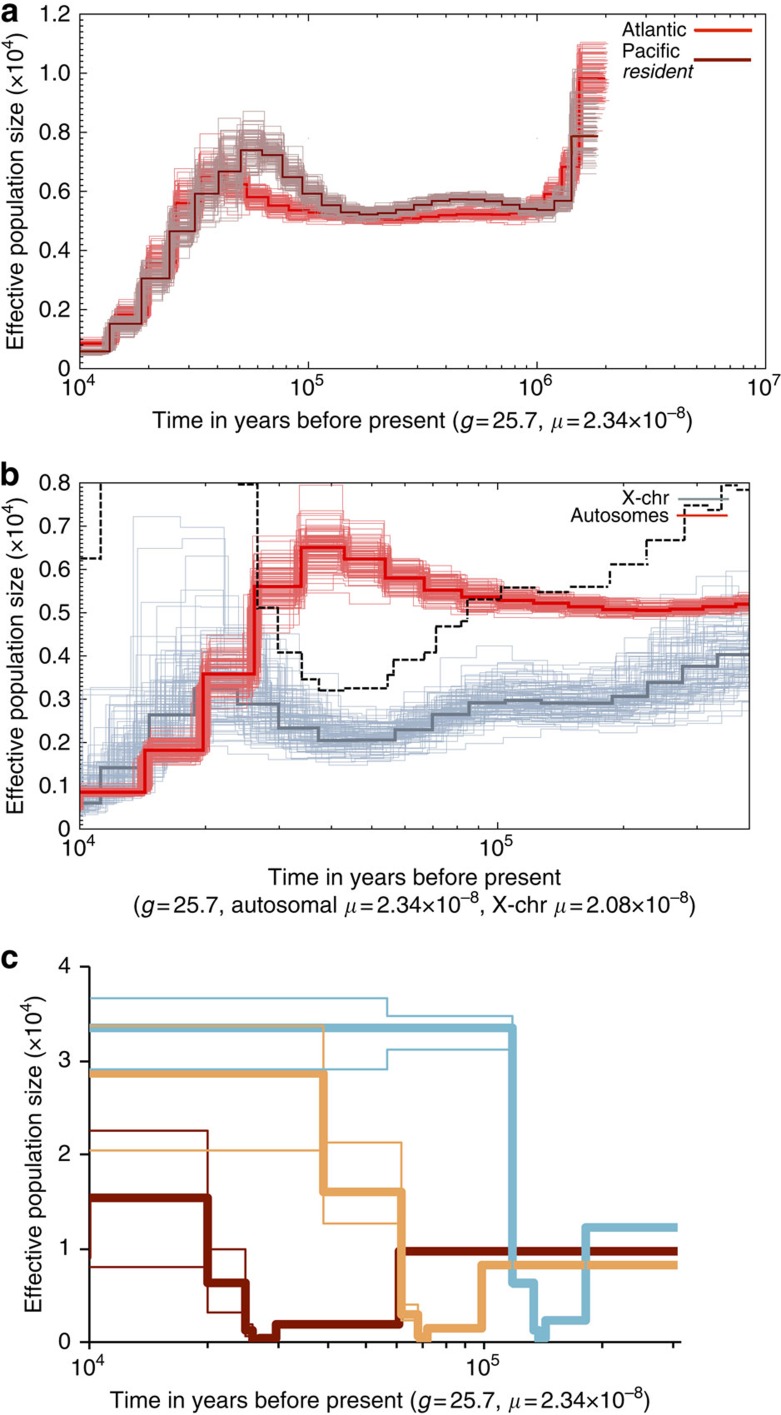
Figure 3. Reconstructing the demographic history of killer whale ecotypes.
(a) PSMC estimates of changes in effective population size (Ne) over time inferred from the autosomes of a North Atlantic killer whale (red) and from the autosomes of a North Pacific resident killer whale (brown). Thick lines represent the median and thin light lines of the same colour correspond to 100 rounds of bootstrapping. (b) PSMC estimates of changes in Ne over time inferred from the autosomes (NeA, red) and the X-chromosome (NeX, grey) of the high-coverage genome sequence of a North Atlantic female killer whale. Thick lines represent the median and thin light lines of the same colour correspond to 100 rounds of bootstrapping. The dashed black line indicates the ratio of NeX/NeA. (c) Changes in effective population size (Ne) over time in the transients (blue), residents (brown) and type C (orange) inferred using the SFS of each ecotype. Thick lines represent the median and thin light lines the 2.5 and 97.5 percentiles of the SFS analysis.

