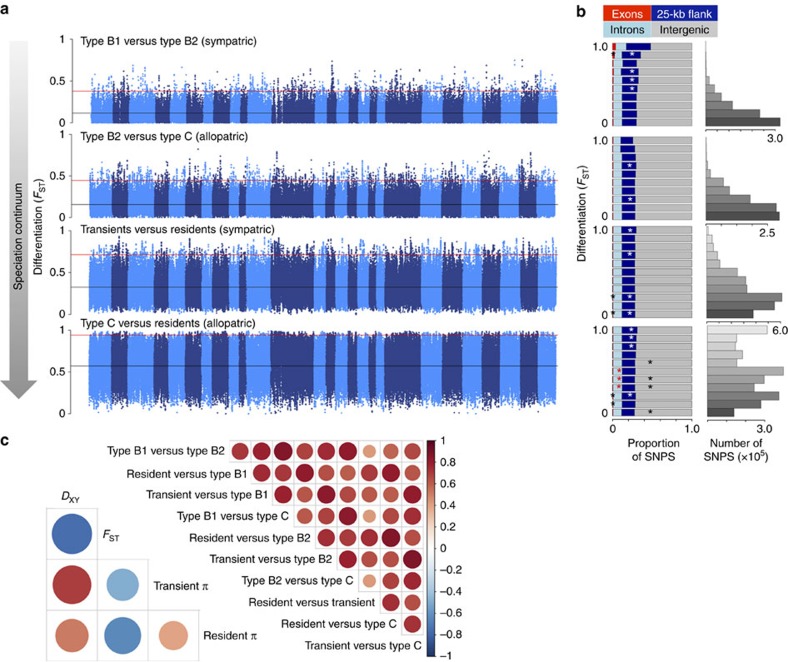
Figure 4. Genome-wide distribution of differentiation.
(a) Pairwise genetic differentiation (FST) in 50-kb sliding windows across the genome between killer whale ecotypes. Pairwise comparisons are arranged from the youngest divergence between sympatric ecotypes to older divergences of now allopatric ecotypes. Alternating shading denotes the different chromosomes; the horizontal black lines mark the mean FST and the horizontal red lines mark the 99th percentile FST. (b) Stacked bar plots show the proportion of SNPs in different genomic regions: exons, introns, 25-kb flanking and intergenic regions, in different FST bins, corresponding to the y axis of the Manhattan plots for each pairwise comparisons. Asterisks signify an over-representation of SNPs in a given region at each FST bin. Bar plots indicate the total number of SNPs in each FST bin for each pairwise comparison. (c) Correlations of 50-kb window-based estimates of differentiation (FST) between all possible pairwise comparisons between ecotypes (above diagonal); correlations between 50-kb window-based estimates of genome-wide divergence (DXY), differentiation (FST) and nucleotide diversity (π) for the pairwise comparison between the resident and transient ecotypes (below the diagonal); other comparisons are shown in Supplementary Fig. 13. Red indicates a positive relationship, blue a negative one; colour intensity and circle size are proportional to Spearman's correlation coefficient. Regions of high differentiation, but low diversity and divergence that are shared across pairwise comparisons, are likely to have been regions of selection on the ancestral form, which would remove linked neutral diversity and result in increased lineage-sorting of allele frequencies in these genomic regions in the derived forms.

