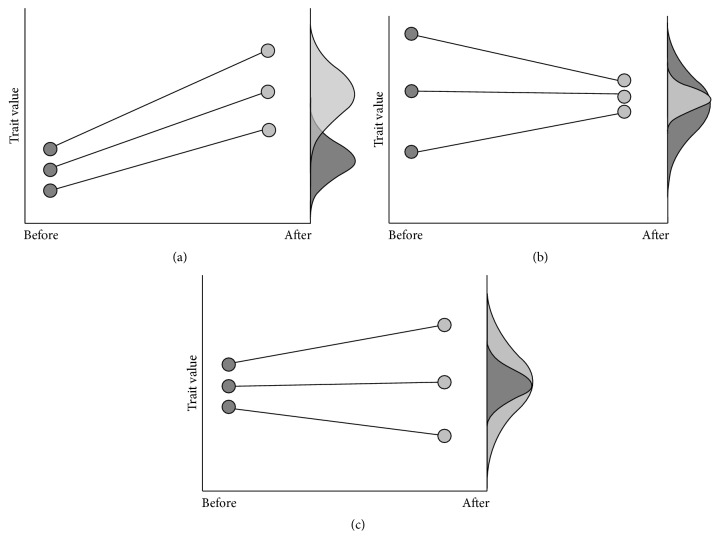
Figure 2.
Scenarios for change in the mean and/or variance of a trait in a population between constitutive phenotypes expressed prior to an interaction (dark shading) and the induced phenotype following an interaction (light shading). (a) An increase in mean and variance of a trait. (b) A decrease in variance, mean unchanged. (c) An increase in variance, mean unchanged from [17].

