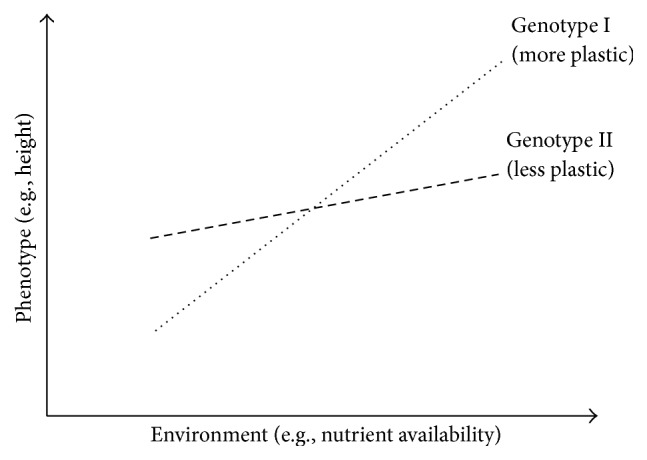
Figure 3.

The lines represent the reaction norms (i.e. the genotype-specific environment-phenotype functions) of each genotype. Both lines have a slope in the environment-phenotype space, which means that both genotypes are plastic. The population shows GxE in the sense that there is genetic variation for the slope of the reaction norm, which would be detected by a standard analysis of variance from [18].
