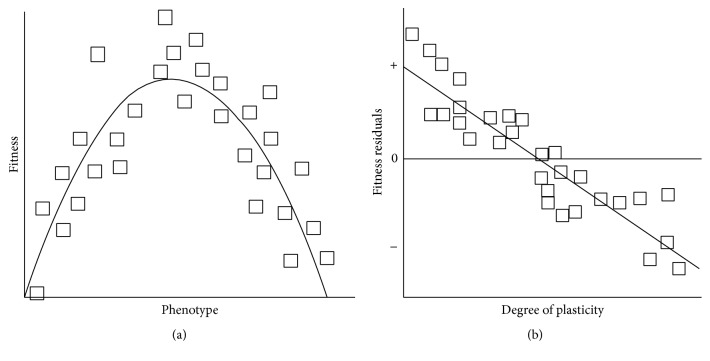
Figure 4.
(a) Relationship between phenotypic values and fitness in one environment for population genotypes. (b) Relationship between degree of plasticity and fitness residuals. There is a cost of plasticity when the slope of the regression is negative from [19].

